Examining Structures
Surgeons say one of OCT’s biggest advantages is its objectivity. Where visual fields rely on patients’ subjective responses and stereo disk photos rely on a clinician’s judgment, OCT gives a quantitative measurement of structures integral to the mechanism of glaucoma. Here’s how physicians use this structural information to track progression.
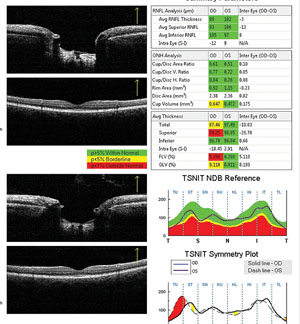
• Retinal nerve fiber layer. Clinicians say looking for signs of thinning in the RNFL is probably the most popular way to watch for glaucomatous progression, but this process comes with some caveats. “The thing to keep in mind is there is an intervisit variability inherent to all imaging devices,” says Sanjay Asrani, MD, professor of ophthalmology at the Duke University School of Medicine. “Therefore, only when the change is beyond that level of variability do I get concerned. For example, the variability of the Heidelberg Engineering Spectralis machine is 5 µm, which we published in the Journal of Glaucoma.1 Because that’s the variability, progression is something I’ll consider as possible if the change in the measurement in a particular quadrant is more than 10 µm. In other words, I wait for two standard deviations of variability before I consider change as a possibility.”
As a rule-of-thumb for detecting change, Dr. Asrani says certain areas of the RNFL are more important than others on OCT. “There are two quadrants I really look at when dealing with the RNFL: the superotemporal and the inferotemporal.
|
Donald Budenz, MD, chairman of the department of ophthalmology at the University of North Carolina at Chapel Hill, says when you start looking at quadrants rather than the total average thickness, the test/retest variability increases. “We have done some studies, as has Christopher Leung, MD, of the Chinese University of Hong Kong, that have found a test/retest variability of 4.5 to 5 µm for the average RNFL thickness with the Cirrus OCT,”2 says Dr. Budenz. “But when you slice the RNFL into quadrants, that number goes to 8 µm and then to around 12 µm for even smaller slices. So, if the patient has focal change it won’t show up in the average thickness until it’s very bad, because you’ll be averaging all the other areas that haven’t changed. However, if you focus on the site of focal change, or a clock-hour of the RNFL, the test/retest variability is very high, meaning you’d need significant change of 12 to 15 µm before you can conclude it’s gotten worse. I think we’re better off relying on the statistical progression software provided by the OCT company that’s been vetted by the FDA, rather than relying on individual numbers. (For a look at the progression tools some OCT companies offer, see the sidebar on p. 42.)
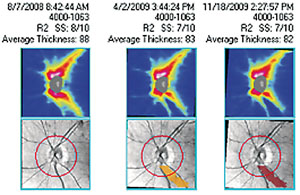
Jean-Claude Mwanza, MD, research assistant professor at the University of North Carolina School of Medicine, says that numbers are crucial, but so is looking at the OCT’s map of the RNFL thickness. “When you’re looking at the RNFL thickness map, it’s the best way to see where the progression has occurred within a defect that you noted previously,” says Dr. Mwanza, who has experience with several OCT devices. “You can tell if the same defect has expanded and/or deepened, or if you have new defects occurring in other places.”
|
When bringing patients in for OCT exams, surgeons generally agree that once every six months is a useful timetable, and they like to have about five measurements before making a decision on progression. “The rule-of-thumb is that it depends on how your device does its statistical progression analysis,” says Dr. Budenz. “If a methodology like linear regression is performed, typically you have to have five measurements. However, the more different the measurements are, the fewer you may need. Just like visual fields, you need a good baseline and good reproducibility with whatever test you’re using. Ideally, these tests should be six months apart, but some clinicians are running into reimbursement roadblocks with that, and may end up doing it once a year instead.”
Confounding Factors
Surgeons say that precisely imaging a complex tissue such as the retina can sometimes be compromised by variables such as co-existing ocular disease.
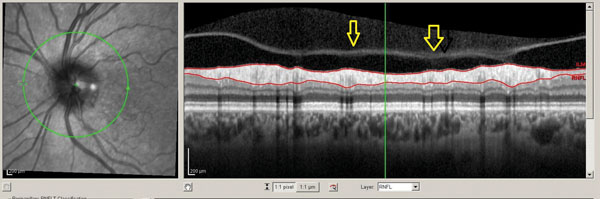
“One of the biggest caveats that a reader of OCT images has to accept is that you have to rule out artifacts before you can accept an apparent change as real,” says Dr. Asrani. “You have to be able to look at the raw image to confirm that the software has identified the top and the bottom of the RNFL properly. Sometimes the software may skip over one part or may include, for example, the edge of an epiretinal membrane or the posterior edge of the vitreous, leading to the RNFL appearing to be thicker.3
“There are two other big artifacts that cause difficulty in monitoring progression with OCT,” Dr. Asrani continues. “One is the evolution of a posterior vitreous detachment. As the vitreous pulls away from the retina, it can cause the RNFL to appear thicker by traction. Then, when it detaches, the RNFL may suddenly appear thinner since the traction has been released and the RNFL has gone back to its normal thickness, and this might appear to be progression. So, one has to be able to see the vitreous interface with the RNFL in the raw scan before one accepts this change as progression. The second artifact that really causes difficulties is the presence of inflammation, namely uveitis. In patients with uveitis, the RNFL can appear normal due to the swelling. Therefore, when the uveitis is controlled, the RNFL that had appeared normal because of swelling now looks much thinner because the swelling has gone away. The tie-breaker in these cases is to look at the macula. Note, however, that just like the RNFL, the macular thickness is also subject to problems such as artifacts and the software not identifying the correct layers. Again, you have to look at the raw images, rule out the artifacts, and then accept the images before you can accept the results. In looking at the macular thickness, the subtraction maps come stratified as to whether the change is 10, 20 or 30 µm; if it’s 10 µm or greater, only then will I give weight to it, so I’m going two standard deviations or greater.”
|
OCT and Perimetry
As tests for progression, experts say that OCT and visual fields often share the top spot, with one surpassing the other in specific patient presentations.
|
“However, even though I’ve used OCT for many years and know its major pitfalls when it’s used alone for progression tracking, I will use it solely for monitoring patients above the age of 80,” Dr. Asrani continues. “A majority of these patients are unable to perform a reliable visual field due to physical changes such as arthritis in the hands. Sitting in front of a perimeter for at least three to five minutes isn’t easy for them. So, I tend to use OCT for this age group without having to have the corresponding change necessarily in the visual field.”
The Floor Effect
Despite OCT’s increasing accuracy, clinicians say there will come a time when the RNFL is too thin to be used as a reliable indicator of progression, a situation they call the floor effect.
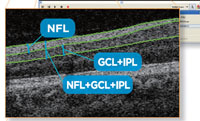
“The floor effect is a real phenomenon,” says Dr. Mwanza. “In short, the RNFL isn’t only made of retinal ganglion cell axons, but also contains the vessels and support cells such as glial and Müller cells. So, when glaucoma is advancing and even when a patient becomes completely blind there will still be something remaining in that layer of the retina, something not related to glaucoma, such as the glial cells, so the layer will not disappear completely and you can still measure it. That’s the floor. Studies with time-domain OCT, the Stratus, found the floor was an average RNFL thickness of 45 µm. So, if you’re following someone with glaucoma and the RNFL reaches 45 µm, even though the patient can still see, this means the average RNFL measurement is no longer useful. You should use something else, maybe visual fields, or you could still follow the sectors of the RNFL but just not the average thickness anymore.”
|
Though tracking progression still involves a number of tests and a good clinical exam, Dr. Barnebey says that clinicians are becoming more comfortable using OCT “Right now, progression is, and has always been, defined by visual field change,” says Dr. Barnebey who notes that, ironically, the definition of glaucoma doesn’t include visual fields. “We recognize that, by the time you see visual field change, you’ve lost a fair amount of nerve fibers. So the appeal of OCT is detecting pre-perimetric glaucoma, or the search for those patients who have structural damage but don’t have reproducible visual field defects. I think more clinicians are depending on the use of the OCT to help them establish an earlier diagnosis.” REVIEW
1. Ghasia FF, El-Dairi M, Freedman SF, Rajani A, Asrani S. Reproducibility of spectral domain optical coherence tomography measurements in adult and pediatric glaucoma. J Glaucoma 2013 May 29. [Epub ahead of print]
2. Mwanza JC, Chang RT, Budenz DL, Durbin MK. Reproducibility of peripapillary retinal nerve fiber layer thickness and optic nerve head parameters measured with cirrus HD-OCT in glaucomatous eyes. Invest Ophthalmol Vis Sci 2010;51:11:5724-30.
3. Asrani S, Essaid L, Alder BD, Santiago-Turla C. Artifacts in spectral-domain optical coherence tomography measurements in glaucoma. JAMA Ophthalmol 2014;132:4:396-402.