Clinical Data and Tomography
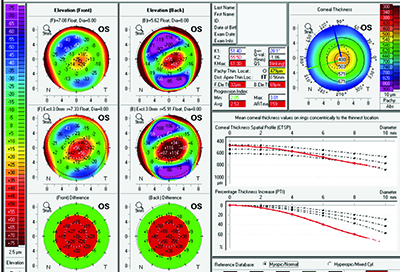
Brazilian ophthalmologist Renato Ambrosio and his co-workers have described their efforts at honing screening parameters in the past, including the development of the Belin-Ambrosio Deviation score, an index on the Oculus Pentacam that can help pick out suspicious corneas. The latest methodology they’ve been working on is called Enhanced Ectasia Susceptibility Screening; it combines clinical data with the Pentacam’s tomography.
Dr. Ambrosio says the new screening method arose out of a need to catch the very subtle cases. “There’s the question of what constitutes mild or forme fruste keratoconus in a susceptible cornea,” he says. “In a study we did at our practice, we found we were still missing about 7 or 8 percent of cases—which is not good. However, we found that if we combine patient age and surgical parameters such as the percentage of tissue that’s altered by the procedure, and perform a linear regression analysis using this data, our accuracy improves. We’re also working on improvements in the final BAD score—or “D” value—in the Pentacam display. Today, the final D relies on the ablation, the thickness distribution and the highest curvature, or KMax. If you have a final D that’s higher than 2.0, it’s 99-percent sensitive in its ability to detect keratoconus.”
To test the effectiveness of combining the clinical data (age, manifest refraction, spherical equivalent, maximum ablation and flap thickness) and the tomographic findings in screening patients, Dr. Ambrosio’s group analyzed the preop clinical and tomographic data from 46 eyes of 38 patients who developed ectasia following LASIK procedures and from 266 control eyes of 141 patients who were stable after LASIK. The researchers found that the EESS using the combined parameters had a 90-percent sensitivity and 92-percent specificity, with an area-under-the-operator curve of 0.936 in terms of distinguishing between the groups (a result of 1.0 would indicate a perfect ability). Dr. Ambrosio says the method they used helped lend statistical weight to the findings. “When we did regression analysis, we tried to combine the factors to give a result that was a zero or a 1,” he explains. “Everyone who was normal after LASIK would be zero, and everyone who was abnormal should be 1.
|
Dr. Ambrosio says the methodology behind the EESS is statistically powerful because it uses actual cases of postop ectasia. “The challenge in screening is that we know some normals may actually have very mild keratoconus and some keratoconus cases may be so mild they might be considered normal,” he says. “Since we’re aiming to detect with sensitivity and specificity the patients who will go on to have ectasia after surgery, actually using patients who had surgery and then did or did not develop ectasia is powerful. We’re actually doing these studies based on a pool of ectasia cases that are sent to me. These cases are rare, especially ones that have the preop tomography data. In fact, any surgeons who have such cases in addition to the tomography data are welcome to send them. We need the files from the Pentacam to actually have all the data for analysis purposes, so we analyze each case in detail and calculate the BAD D value and develop future algorithms for the new regression analysis.”
OCT and Topography
Jules Stein Eye Institute ophthalmologist Yaron Rabinowitz has found that bringing together optical coherence tomography with videokeratography (topography) helps paint a more complete picture of at-risk patients than just videokeratography alone.
Dr. Rabinowitz says he combined the technologies to fill in some gaps that may exist in corneal topographic screening. “I previously developed an index based on videokeratography called the inferior/superior dioptric asymmetry index, or I-S value,” he says. “One of the criticisms of the I-S value is that videokeratography only looks at the anterior part of the cornea, not the posterior aspect.” To help remedy this issue, he began to consider OCT as a complementary modality to topography. “OCT is good at measuring the thinning of the cornea,” he notes. “This is helpful in screening because in keratoconus the cornea also thins in addition to becoming more asymmetric on topography. OCT also covers about 8mm of the cornea, and isn’t limited to pachymetry in just the central or inferior region. So, if you want to have an index that will catch whether a cornea will eventually become keratoconic or a method that will help track keratoconus, you should follow both anterior surface changes and pachymetry, the latter of which involves the posterior surface. This gives you a three-dimensional look at the cornea.”
The way Dr. Rabinowitz combines the technologies is to take the minimum pachymetry from OCT—i.e., the thinnest point—and combine it with the I-S value from the topography. Specifically, he divides the minimum pachymetry (PA) by four and multiplies the result by the I-S value. “This gives what I call the PA/I-S value,” he explains. “The lower the PA/I-S value, the greater the likelihood the patient has keratoconus. The higher the value, the greater the likelihood the cornea is normal. As a cutoff, anything less than 100 on the index is keratoconus and anything greater is normal.”
In a study of the new index, Dr. Rabinowitz and his colleagues were able to identify 100 percent of early and forme fruste keratoconus as keratoconus, with seven normal patients being misclassified as abnormal (misclassification rate of 2.7 percent).1 The researchers say the index helped reduce the misclassification rate of keratoconus suspects, a group they say is perennially hard to diagnose. When they only used the I-S value for the patients, they classified five keratoconus suspects as normal and 11 normals as keratoconus, for a misclassification rate of 7.8 percent. When they used the PA/I-S index, however, the misclassification rate shrunk to 4.4 percent.
Dr. Rabinowitz says the index has also proven useful for tracking treatments for corneal conditions. “It’s also been helpful when tracking corneal collagen cross-linking,” he says. “With cross-linking, you want to know if a patient’s cornea is progressing—getting thinner or becoming more keratoconic—and using this index is a good way to track the progression or, conversely, to show that cross-linking is working because there is no progression based on the index.” REVIEW
Drs. Ambrosio and Belin are consultants to Oculus.
1. Rabinowitz Y, Li X, Canedo A, et al. OCT combined with videokeratography to differentiate mild keratoconus subtypes. J Refract Surg 2014;30:2:80-87.


