Managing glaucoma involves numerous challenges, among them diagnosis, choosing and implementing appropriate therapy and interacting with your patients in a positive, anxiety-reducing way. But one of the toughest challenges of all is monitoring the progression of the disease once it’s been diagnosed. The difficulty largely stems from the fact that the damage caused by the disease occurs very slowly and can be very subtle. Furthermore, the technologies currently available to serve this purpose—ranging from stereo photographs to different types of perimetry to various forms of digital imaging—all have significant limitations.
Here, three experienced surgeons share their thoughts and advice on the best ways to use the tools at hand—and some new ones in the pipeline—to do an effective job of monitoring glaucoma progression.
Visual Fields and Photographs
“There’s really no ideal way to measure progression,” says Alan L. Robin, MD, clinical professor of ophthalmology at the University of Maryland and associate professor of ophthalmology and international health at Johns Hopkins University. “Huge changes in visual fields or the appearance of the optic nerve are easy to observe, but finer differences that could be significant are often difficult to detect.
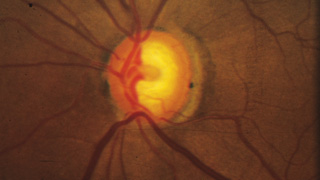
“One of the least effective ways to track the condition of the optic nerve is to simply write a description such as a cup-to-disc ratio or draw a picture in the chart,” he continues. “These are inadequate because the disc changes both in depth and in size, and sometimes very subtly. You simply can’t capture that with a cup-to-disc ratio or a drawing, unless you’re truly a wonderful graphic artist. Disc imaging is a better option, especially photographs—although even stereo photography can have issues involving background illumination and problems with magnification that can lead to subtle differences being missed.”
Despite their imperfections, Dr. Robin believes that stereo photographs are invaluable in all stages of the disease, except when the disease is very advanced. “I think if you know what you’re looking for, you can detect subtle changes very reproducibly using stereo photographs,” he says. “Are photographs perfect? No. Are they worthless in end-stage disease? Yes. But for early to mid-stage disease, they are unquestionably valuable.”
“Right now, the gold standard for progression is photographically documented optic disc change—specifically, glaucomatous cupping that progresses over time—and changes in white-on-white automated perimetry,” says Donald Budenz, MD, MPH, chairman of the Department of Ophthalmology at the University of North Carolina. “Unfortunately, both of those gold standards are problematic. Although optic disc images are objective—a picture is a picture, after all—our assessment of them is subjective. There aren’t any numbers associated with them, and even if we’re comparing one photograph to another we’re making a qualitative judgment as to whether or not there’s been significant change.
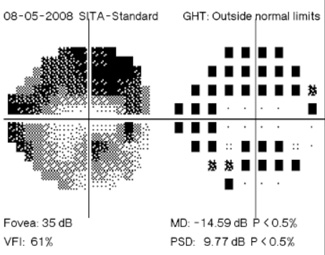
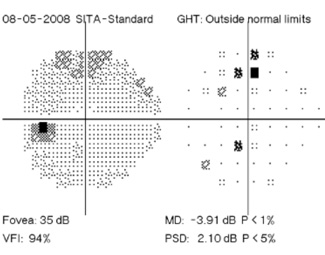
“With visual fields we have a different problem,” he continues. “Our interpretation has more objective indicators—numbers and statistical parameters—but the test itself is subjective because the patient is being asked to report whether or not he sees spots of light. In some ways visual field tests have improved in recent years; we’ve found better ways to analyze the numbers and we’ve made the tests shorter and easier for the patient, so we get somewhat more reliable results. But both methods for diagnosing progression still have a subjective component, and there hasn’t been any major improvement in clinician assessment of stereo photographs or visual field data in a couple of decades.
“What we’re moving towards,” he adds, “is an objective test with an objective interpretation.”
| |||||||||||||||||||||||||||||
The Pros and Cons of OCT
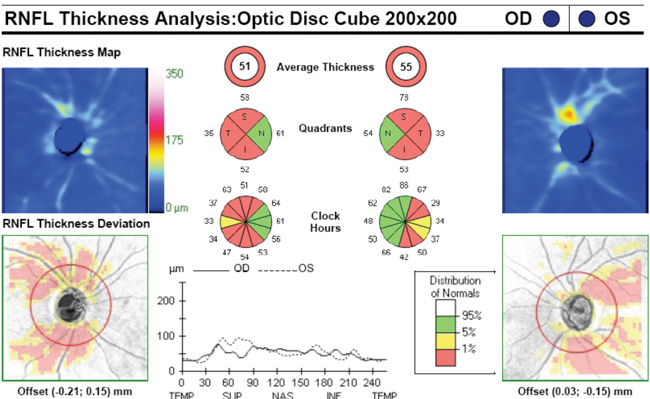
Dr. Budenz says that optical coherence tomography, in particular, is emerging as a biomarker for glaucoma progression. “We know from pathology studies that as glaucoma progresses there’s a loss of ganglion cell bodies and their axons,” he notes. “Each of these layers can be measured by OCT, either separately or together, and OCT can also give us a cross-sectional image of them similar to a histologic section. If OCT scans reveal a change in the thickness of the retinal nerve fiber layer or ganglion cell body layer—beyond what would be expected because of age and the test-retest variability of the instrument, which is quite small—that would be a definitive indicator of glaucoma progression in a known glaucoma patient. So OCT has the potential to provide us with both an objective measurement and an objective interpretation.”
Dr. Robin, however, notes a number of problems associated with depending on either current OCT or confocal laser scanning technology. “In my opinion, the imaging software that comes with the HRT and OCT instruments still doesn’t pick up subtle changes, and both the autoregistration technology and the technician’s ability to perform the test can make significant differences in the usefulness of the result,” he says. “Neither of these technologies was really meant to analyze the optic nerve; they’re macular and nerve fiber layer devices. In addition, patients with advanced glaucoma have almost total cupping, making it very difficult to monitor progression with imaging at that point in the disease.”
Dr. Budenz agrees that OCT’s potential hasn’t been achieved just yet, but is primarily concerned about another issue. “We have the formulas to use for this purpose and the numbers to put into them, but any new system requires longitudinal validation, and that is currently lacking,” he points out. “It’s considered unethical to not treat someone with manifest glaucoma, so we’re treating all the patients we’re studying. Glaucoma generally progresses slowly in treated patients, if it progresses at all. So it takes a lot of patients and a long period of time to validate any new instrument for diagnosing glaucoma progression.
“Another reason longitudinal validation is lacking is that the technology has been changing so quickly,” he says. “We have a different OCT platform now than we did five years ago, and the numbers are not transferable. Hopefully that won’t be the case with future platforms. That would help us assemble the seven to 10 or 12 years of longitudinal data we’d like to have to validate OCT as a means of diagnosing glaucoma progression.”
|
Digital Analysis 2012
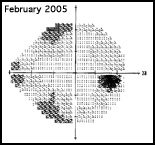
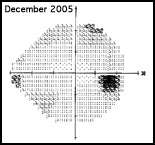
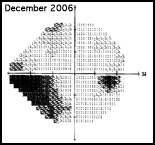
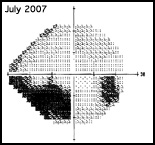
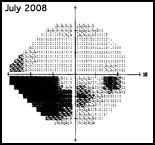
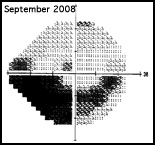
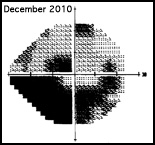
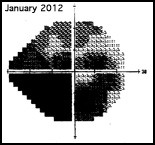
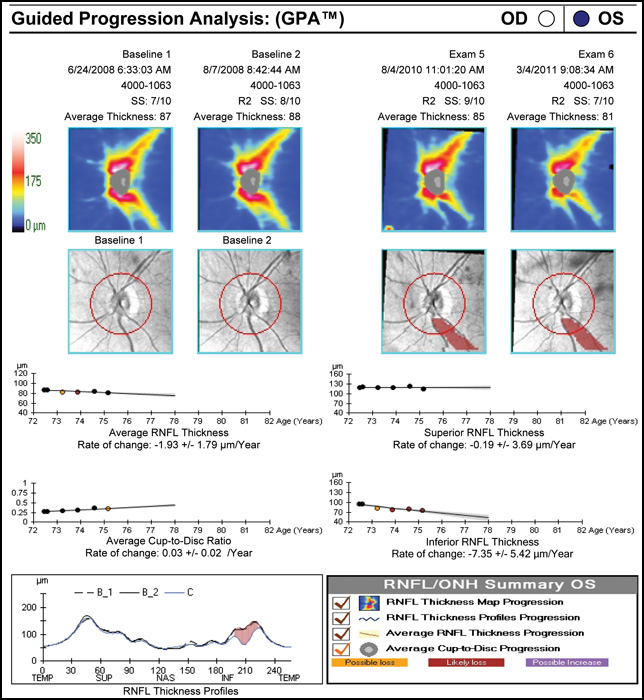
Regarding what doctors can do to use OCT for monitoring progression today, Dr. Budenz notes that the current software for Zeiss’s Cirrus OCT (version 6.0) includes some progression analysis. “However, it’s relatively rudimentary,” he says. “It analyzes the change in average retinal nerve fiber layer thickness over time and in the superior and inferior regions—what we would call a trend analysis. [See sample, above.] If the slope of the thickness line is going down at a rate that’s beyond what one would expect because of age or the test-retest variability, a significant p value is given, indicating possible progression.
“For glaucoma specialists, this represents a big step forward in our ability to diagnose glaucoma and glaucoma progression,” he says. “The problem is that this approach may miss localized progression, which is what we actually find on visual field tests most times. We’d like to see a combination of global indices and information about changes in specific areas.”
Dr. Budenz observes that non-OCT technologies such as confocal scanning laser tomography and scanning laser polarimetry are less often discussed today, at least in terms of managing glaucoma. “I think OCT does what those two technologies do—it measures optic nerve head and retinal nerve fiber layer parameters, and it does it better, all in a single instrument. Of course, it costs twice as much as either of the other technologies, but that cost can be offset by its usefulness in other areas of ophthalmology, such as retina and neuro-ophthalmology.”
Imaging Early, Fields Late?
Dr. Budenz notes that both visual fields and OCT have limitations when it comes to detecting progression. “With OCT imaging in glaucoma, there’s a ‘floor effect,’ ” he says. “For example, let’s say retinal nerve fiber layer thickness in a normal eye averages 100 µm. Once a patient progresses to moderate glaucoma as measured by visual fields, the retinal nerve fiber layer doesn’t get any thinner than about 50 µm as measured by OCT.
There are probably several reasons for that, but the simplest explanation is that there are other cells in the nerve fiber layer besides axons, many of which are not destroyed by glaucoma. As a result, there will always be some thickness to the nerve fiber layer no matter how much the glaucoma progresses, so it ceases to be a useful parameter for monitoring progression beyond a certain point.
|
“All of the imaging instruments have this limitation, so you have to come up with other strategies to make sure that someone with moderate to severe glaucoma isn’t getting worse,” he says. “Visual fields are still pretty good for monitoring progression late in the disease, because you can increase the spot size or focus in on the central five or 10 degrees to see if people are progressing.”
Dr. Budenz notes that visual fields have a different limitation. “Because there’s a lot of redundancy in the photoreceptors and ganglion cells,” he says, “early in the course of the disease you can lose 25 to 35 percent of your retinal ganglion cells before you can detect a defect using visual fields.1,2 In contrast, OCT scans may turn out to be an effective way to monitor early glaucoma progression before visual field defects appear. Of course, a lot of early glaucoma patients have a normal retinal nerve fiber layer as well, but since the test-retest variability of the instrument is so good, you can probably detect thinning of the nerve fiber layer long before you’ll see a change in the visual field. So far, this strategy hasn’t been widely adopted, but I think that may be the next frontier.”
“To monitor progression it’s important to be able to differentiate true progression from test-retest variability, and to have tests that are sensitive throughout the spectrum of the disease,” says Felipe A. Medeiros, MD, MS, PhD, professor of clinical ophthalmology and medical director of the Hamilton Glaucoma Center at the University of California, San Diego. “To achieve the latter goal, you may actually need a combination of tests, because one particular test might not be able to do that alone.
“Many clinicians rely heavily on visual fields,” he continues. “The problem is that visual fields are not sensitive enough to early disease. A number of studies have demonstrated that you need to lose a significant percentage of your ganglion cells in order to produce a statistically significant visual field defect. This not only affects the test’s ability to diagnose early disease, but also can lead to underestimating the rate of disease progression in the early stages. For that reason, it’s important to also use structural assessment of the optic nerve and nerve fiber layer early in the disease, with either optic disc photographs or imaging devices. The advantage of imaging devices is that they provide us with quantitative measures, so you can get a quantitative assessment of the rate of change.”
Dr. Medeiros acknowledges that some doctors feel imaging technology isn’t ready for this kind of use. “I suspect people are looking for a perfect relationship between what we see in visual fields and in imaging,” he says. “We shouldn’t expect that kind of agreement, because visual fields are measured and reported using the decibel scale, which is logarithmic. In contrast, when we use imaging to measure something like nerve fiber layer thickness, we’re using a linear scale. The difference in scales results in potential disagreements between the two methods.”
Dr. Medeiros believes imaging is definitely up to the job of monitoring progression, at least in many stages of the disease. “Now that there’s been enough time to accumulate some longitudinal data, many studies using different technologies, such as confocal scanning laser ophthalmoscopy, scanning laser polarimetry and OCT, have shown that these instruments are able to detect progression and measure rates of change,” he says.
Despite visual fields’ limited ability to detect change in early disease, Dr. Budenz believes they will continue to be useful, even in very early disease. “I think you still need to do a visual field once a year to determine when a patient goes from normal to abnormal because that’s one of the gold standard ways of diagnosing and following glaucoma,” he says. “Furthermore, OCT has a certain false-positive rate, as any medical test does, and factors other than glaucoma, such as axial myopia, can affect our interpretation of what’s normal and abnormal. The visual field will always be a reality check. So I don’t think it’s time to throw out the visual field analyzer yet.”
Dr. Robin agrees, cautioning against relying too much on laser imaging early in the disease. “I think there are too many false positives and false negatives when using OCT in early disease to help out the general physician,” he says. “If it were my own eyes, I don’t think I’d trust the diagnosis solely to the OCT. Consider the Ocular Hypertension Treatment Study. Approximately 30 percent of early changes were only picked up on visual fields, not on optic nerve scans. So I think you really have to look at both parameters, form and function, and intelligently synthesize them.”
Dr. Budenz believes that OCT could conceivably replace optic disc photography somewhere down the line. “Optic nerve measurements with OCT are so good now that if the platform were to stay stable over a five or 10 year period—which is a big if—and we could validate the data, then OCT could potentially replace optic disc photography,” he says. “But I think there will always be room for the visual field, both early and late in the disease. Ultimately, what clinicians will do is get as many data points as they can, be it visual field or OCT. We’ll try to take all things into consideration, while still making a subjective determination as to whether the patient is progressing or not. But we’ll have better tools to take measurements and help us decide what to do.”
Dr. Robin notes another problem with clinical use of visual fields: Many clinicians are not doing enough of them. “You really need at least two visual fields per year to detect early changes, as Bal Chauhan has demonstrated,” he says. [For more on this, see Dr. Chauhan’s article,
How Many Visual Fields are Enough? in the July 2011 issue of Review.] “There’s so much noise in the visual field progression algorithm that it’s hard to know if the visual field changes you find are truly changes or just short-term fluctuations. Consider some of the high-profile multicenter glaucoma studies: The Normal Tension Glaucoma Treatment Study required five visual fields to confirm progression; the Advanced Glaucoma Intervention Study required three. Clearly, more than one visual field is needed to determine change.
“Ultimately, we need a way of assessing clinically significant functional change that’s patient-independent,” he adds. “There’s so much variability in visual fields, and so many people have trouble doing them, that it would be
nice to take the patient out of the algorithm.”
Combining Structure & Function
Given the advantages and limitations of visual fields and imaging technologies, Dr. Medeiros’s group has focused on making the technologies work together. “Our recent work has demonstrated that when you successfully combine structural and functional information, you get a lot of improvement in the detection of progression,” he says. “As already noted, the difficulty in combining the measurements is largely the result of the data being presented in completely different scales. So what we did was transform both visual field threshold sensitivities and OCT nerve fiber layer thickness measurements into a common scale: estimated retinal ganglion cell counts. That allows them to be combined. We’ve demonstrated that when you do that, they actually agree quite well, and the combination allows us to get better estimates of the rate of ganglion cell loss.”
Dr. Budenz agrees that combining structural and functional information is a very promising approach. “In clinical practice there are patients in whom structure and function don’t change simultaneously, and you don’t know whether you’re seeing a false positive,” he says. “Hopefully, this new approach of combining the two types of data will help us decide how to proceed. Certainly that’s the direction in which the field needs to move.”
|
“The second report,” he continues, “will be published soon in the American Journal of Ophthalmology.4 It includes study data showing that the combined index of retinal ganglion cell loss is more sensitive for detection of progression—i.e., it detects more cases of progression—than visual fields or OCT alone, yet it has the same level of specificity. So there’s no negative trade-off.”
Dr. Medeiros says his group is working with multiple companies that are interested in implementing the new index in their machines. “This will give clinicians a new way to more accurately stage the disease and monitor progression,” he says. “Obviously clinicians don’t want to go through all of the calculations involved in converting the data, but the software can do that. The system will collect visual field and OCT data, run the algorithm and provide clinicians with the combined output. We expect this to be available soon.” He notes that the university has a patent pending on the algorithm for combining the data.
Dr. Medeiros says he’s aware that some companies have already tried to provide clinicians with combined data. “Some instruments show the two types of data next to each other by displaying visual fields and OCT printouts side-by-side onscreen,” he explains. “However, no combined index of glaucomatous damage is being calculated. And that’s the whole problem, as clinicians frequently have trouble analyzing the two sources of data, especially when there is apparent discrepancy in the results. By integrating the data, our algorithm eliminates the confusion, potentially helping clinicians with the decision-making process.”
Dr. Medeiros says it remains to be seen whether this system might result in clinicians needing to perform fewer tests overall. “If you’re trying to manage something, the more information you have about it, the better,” he says. “That’s the reason, for example, that we do multiple visual fields; having more measurements improves the precision of our estimate regarding what’s happening. If I’m able to use two reliable sources of information to give me an estimate of ganglion cell loss, that will give me an even more precise estimate than just using a single source. So it’s reasonable to expect that the new system will result in earlier detection of change, and perhaps will decrease the number of tests necessary to detect change. At the same time, the more tests of any kind you conduct, the more precise your analysis. So how this will impact the number of tests that work best in the clinic remains to be seen. In the meantime, I think we can safely say that this approach will give you better information than relying on a single source such as visual fields.”
| |||||||||||||||||||
Adding in the Risk Factor
Dr. Medeiros and colleagues have also conducted work on incorporating risk factors into the assessment of progression. “The final purpose is to develop a comprehensive method that incorporates structural and functional information and risk factors, to better detect change and predict clinically relevant outcomes,” he says. “If I have a patient who has done a series of tests over time, and I’m trying to decide whether that person has progressed or not, knowing the status of other potential risk factors could be key. For example, if I know that this person had a high mean IOP during follow-up, let’s say 28 mmHg, the likelihood that this person will actually be undergoing progression is greater than if the eye had a mean IOP of 10 mmHg. You can use this information to help you interpret the results you obtain with structural and functional tests over time.
“We’ve developed an approach using Bayesian statistics that allows us to incorporate risk factors into the assessment of glaucoma progression, as described in a recent paper,” he continues.5 “This method allows the estimate of the slope of change—a measure of how fast a patient is progressing—to be weighted by factors such as the presence of disc hemorrhages, high IOP, thin corneas and the patient’s age. Any measurement we take is subject to error and variability, so we can never be absolutely certain about the true slope of change, but this algorithm improves the accuracy of our estimate.
“This approach also takes into account the number of tests you’ve performed,” he adds. “For example, suppose you’ve acquired a lot of measurements over time for a given patient, and those measurements show progression very clearly. No matter what the risk factors are, you know that person is getting worse. So, the method automatically relies less on the risk factor analysis, simply because you have so much data. On the other hand, if you only have a few visual fields to base your analysis on, the algorithm will weight the patient’s risk factors more heavily.”
Alternate Perimetries
Other forms of perimetry such as frequency-doubling technology and blue-on-yellow perimetry have become more popular in recent years, although most surgeons see them as primarily useful for screening or diagnosis, not for monitoring progression.
“Frequency-doubling is really more useful as a screening tool,” says Dr. Robin. “Some studies have suggested that blue-on-yellow perimetry might detect changes as much as five years earlier than standard white-on-white perimetry, but in my practice I haven’t seen that. Furthermore, there’s so much more noise in a blue/yellow visual field that it’s hard to know when you have a change. Also, patients have more trouble taking that test.”
Dr. Budenz says he has not adopted any of the alternate perimetries as part of his workup for glaucoma or glaucoma progression. “There are too many false-positive results,” he says. “They can lead you treat patients needlessly. If you want to use them in conjunction with standard evaluations to diagnose early glaucoma, I don’t think there’s anything wrong with that—as long as you realize that there can be false-positive results, and not everybody should be treated just because they have a positive result with one of these tests.
“Personally,” he adds, “I don’t think the evidence is strong enough to justify their use at this point. Certainly for glaucoma progression, the data does not look good. So I would discourage clinicians from using these methodologies for monitoring progression.”
Despite these concerns, Dr.
Medeiros says his team is working to provide the same type of combined structure/function analyses for alternate types of perimetry such as frequency-doubling technology. “This is exciting, because it might result in even further improvement of our ability to estimate ganglion cell loss,” he says. “On the other hand, the fact that the system we’ve already developed allows you to combine structure and function could remove the advantage that FDT has over standard perimetry. Time will tell.”
Pearls for Protocol
Dr. Budenz says he’d recommend three strategies for monitoring progression. “First, collect meaningful data, meaning white-on-white perimetry, stereoscopic optic disc photographs and OCT,” he says. He notes that he does OCT, visual fields and optic disc photographs in all of his new glaucoma patients and glaucoma suspects. “After that, I recommend doing a visual field every six to 12 months and an OCT every 12 months,” he says.
“As far as optic disc photographs, after the baseline photo I only take a photograph if I think there’s been a change when I look at the patient at the slit lamp, for purposes of comparison,” he continues. “During my annual dilated examination for a glaucoma patient, I look at the optic disc and I look at the existing disc photographs. If I see a change, I’ll get another optic disc photograph to be sure, because you can perceive false positive changes when you compare what you’re seeing at the slit lamp with what you see in a photograph. On the other hand, if the eye in vivo looks the same to me as the existing photographs, I’m comfortable it’s the same.”
Dr. Budenz notes that there are additional advantages to having a baseline stereo photograph. “Patients move around a lot,” he points out. “When they do, you can easily send a visual image of the optic nerve to the patient or to the new treating physician, so they can compare what they’re seeing in follow-up to what things looked like at baseline.
“A second important strategy is to take a good look at the patient to make sure there aren’t any disease processes that could interfere with the diagnosis,” he says. “Many things can look like glaucoma progression on a visual field that are not glaucoma. Third, always confirm any suspected progression you see on a visual field by doing another visual field or two, because of the variability of visual field testing. Never assume somebody is progressing based on a single visual field.”
Dr. Medeiros agrees. “One of the main problems we have is the variability of testing over time, so it’s important to repeat tests to obtain confirmation of suspected changes,” he says. “And the more tests you can do, the better.
“A second thing to remember is that you can’t rely entirely on visual fields for the detection of early to moderate changes, because they will likely underestimate the progression of the disease,” he adds. “At the same time, imaging doesn’t work very well for detecting progression when you have advanced disease. So it’s important to use both structure and function in clinical practice.”
Dr. Robin notes that there’s value in following the guidelines established in the American Academy of Ophthalmology’s Preferred Practice Patterns. “Research has shown that many doctors don’t follow the recommendations regarding how often to image the optic nerve and perform visual fields.6,7 So the first thing I would recommend is to actually read those recommendations and follow them,” he says. “Second, don’t rely on writing down a cup/disc ratio or drawing a picture. Those approaches are almost worthless if you’re looking for mild to moderate changes. Instead, use digital photography to document the optic nerve. Finally, visual fields are very important, even in early disease and even in ocular hypertensives. It’s important to get visual fields to use as a baseline, to ensure that you’re not missing subtle changes over time.” REVIEW
Dr. Medeiros has received research support from Carl Zeiss Meditec, Heidelberg Engineering and Optivue, but his research into combining structural and functional information is primarily funded by the National Institutes of Health. Should this method eventually be licensed, Dr. Medeiros may receive a portion of the royalties. Drs. Robin and Budenz have no financial interests relevant to any technologies discussed in this article.
1. Mikelberg FS, Yidegiligne HM, Schulzer M. Optic nerve axon count and axon diameter in patients with ocular hypertension and normal visual fields. Ophthalmology 1995;102:2:342-8.
2. Kerrigan-Baumrind LA, Quigley HA, Pease ME, Kerrigan DF, Mitchell RS. Number of ganglion cells in glaucoma eyes compared with threshold visual field tests in the same persons. Invest Ophthalmol Vis Sci. 2000;41:3:741-8.
3. Medeiros FA, Lisboa R, Weinreb RN, Girkin CA, Liebmann JM, Zangwilll LM. A Combined Index of Structure and Function for Staging Glaucomatous Damage. Arch Ophthalmol (in press).
4. Medeiros FA, Zangwill LM, Anderson D, Liebmann JM, Girkin C, Harwerth R, et al. Estimating the Rate of Retinal Ganglion Cell Loss in Glaucoma. Am J Ophthalmol (in press).
5. Medeiros FA, Zangwill LM, Mansouri K, Lisboa R, Tafreshi A, Weinreb RN. Incorporating risk factors to improve the assessment of rates of glaucomatous progression. Invest Ophthalmol Vis Sci. 2012;53:4:2199-207.
6. Fremont AM, Lee PP, Mangione CM, Kapur K, Adams JL, Wickstrom SL, Escarce JJ. Patterns of care for open-angle glaucoma in managed care. Arch Ophthalmol 2003;121:6:777-83.
7. Hertzog LH, Albrecht KG, LaBree L, Lee PP. Glaucoma care and conformance with preferred practice patterns. Examination of the private, community-based ophthalmologist. Ophthalmology 1996;103:7:1009-13.