When it comes to managing glaucoma, we have plenty of technologies to help us. Nevertheless, new options are always welcome—especially if they increase our ability to detect and monitor the disease, while making clinic visits a little less burdensome for patients.
I believe optical coherence tomographic angiography is exactly that kind of technology. OCTA makes it easy to monitor blood flow within the retina, giving us a new way to evaluate the health of the ganglion cells that can be devastated by the disease.
Blood Flow and Glaucoma
The idea of evaluating glaucomatous damage by measuring blood flow is hardly new. Ophthalmologists who have been in the field for many years point out that the correlation between blood flow and glaucomatous dam-age was clear decades ago. Using fluorescein angiography, they showed that glaucomatous damage was ac-companied by reduced fluorescence, as well as delayed vascular filling. However, fluorescein angiography is invasive and only semi-quantitative, making it impractical for the routine clinical monitoring of glaucoma. Several other imaging technologies, such as Doppler ultrasound, Doppler OCT, laser Doppler flowmetry, and laser speckle flowgraphy have also been used to show that retinal and optic nerve blood flow are reduced in glaucoma patients. However, these instruments have high measurement variability and are more suitable for detecting differences between groups of research subjects than performing diagnostic evaluation in individual patients.
OCTA is different from these previous instruments in two important ways. First, OCTA is noninvasive. Second, OCTA can measure vessel density with high repeatability and reproducibility. Since each OCTA scan takes just a few seconds, it can easily be done at every glaucoma patient visit. And because the measurements are precise, it can be used to make a diagnosis and monitor dis-
ease progression.
How Does OCTA Work?
The way OCTA detects blood vessels down to the capillary level is straightforward. The OCTA soft-ware compares sequential cross-sectional OCT image frames at the same position, looking for signal fluctuations that indicate blood flow. Our group has been heavily involved in developing and testing this technology. Among other things, we’ve developed an algorithm called split-spectrum amplitude-decorrelation angiography—SSADA for short—that’s so efficient that you just need two frames to accurately identify capillaries.1 This efficient algorithm, along with improvements in the speed of Fourier-domain OCT, made clinical OCTA feasible.
Since OCTA senses motion, it’s susceptible to artifacts produced by bulk eye motion such as micro-saccades, ocular pulsation and ocular drift. Therefore high-speed, active eye tracking, image registration postprocessing and bulk motion sub-traction algorithms are all needed to produce high-quality OCTA images. These technical requirements have
stimulated rapid advances in commercial OCT technology on both hardware and software fronts.
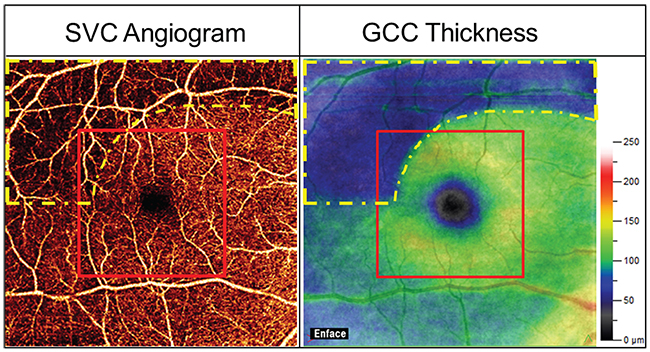 |
| Figure 1. 6 x 6-mm superficial vascular complex (SVC) OCT angiogram (left) and 6 x 6-mm ganglion cell complex thickness map (right) of a typical glaucomatous eye. The glaucoma damage (yellow dashed outline) was mostly outside the central 3 x 3-mm area (the red outline). Thus the larger scan area is needed for early detection of the pattern of damage common in glaucoma. |
Where to Look for Glaucoma
We first used OCTA to study altered blood flow in glaucoma patients in 2014.2 In that study, we scanned the optic nerve head. We found that glaucoma patients have reduced capillary density and flow index at the level of superficial disc tissue and at the plane of the lamina cribrosa. The flow deficit at the lamina cribrosa was intriguing because this is potentially the site where elevated intraocular pressure could affect optic nerve per-
fusion. However, for routine diagnostic purposes, the optic nerve head is not an ideal image target due to shadowing of neural tissue from numerous large blood vessels and highly variable geometry of the disc rim and vessels.
So, when we turned our attention to designing the ideal diagnostic scans for glaucoma, we decided to focus on the peripapillary retina3 and macula.4 In both of these regions, we found that the retinal vessel density provided excellent diagnostic accuracy. Furthermore, vessel density correlated well with visual field parameters—better than with structural OCT parameters such as the overall retinal nerve fiber layer thickness.
It’s worth noting that OCTA scans must cover sufficient area to provide accurate diagnostic information. For the peripapillary region, we’ve found that a 4.5 x 4.5-mm scan provides the best diagnostic accuracy. For the macular region, a 6 x 6-mm scan is needed (See Figure 1). There have been studies that used small macular OCTA scans of 3 or 4 mm areas that found poor diagnostic accuracy. That’s to be expected, because glaucoma affects the peripheral portions of the macula first.
Flow Rate or Vessel Density?
When we began to investigate functional imaging for glaucoma, we first focused on measuring volumetric flow rate with Doppler OCT,5 then on measuring flow index with OCTA.2 However, we found the reproducibility of these flow measurements to be poor. The fundamental reason may be that the velocity and volumetric rate of blood flow are affected by variations in the patient’s physiologic state. For example, we’ve demonstrated that these measurements are affected by the oxygen concentration in inhaled gas mixture and by visual stimulation. There may also be many other factors that affect blood flow.
In contrast, we’ve found that the reproducibility of vessel density measurements by OCTA is excellent. Vessel density is measured on en face OCTA images of the appropriate anatomic slabs. A “projection” operation is used to select the maximum flow value within the slab’s depth range, so that the three-dimensional OCTA data is reduced to a two-dimensional en face angiogram. The vessel density can be defined by the percent area occupied by vascular pixels (pixels with higher flow signal relative to the nonvascular background) in the en face angiogram. Large vessels can be excluded if one wishes to measure capillary density; the latter may be useful in assessing perfusion in smaller sectors, so that variations in the course of large vessels don’t unduly bias the measurement.
For glaucoma assessment, we believe that percent area vessel density and capillary density are the ideal metrics for diagnosis and monitoring.
 |
|
|
Which Plexuses are Affected?
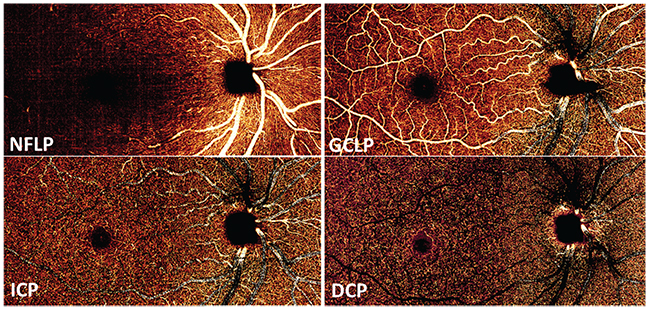
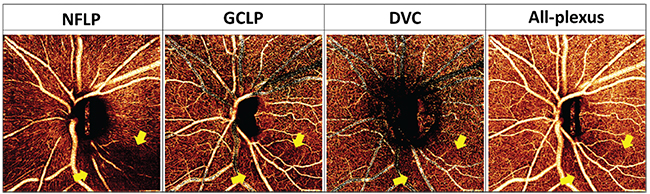
In the earlier OCTA studies, we looked at the retinal circulation as a single slab, because blood flow in the superficial plexuses cast time-varying shadows onto deeper layers that are also detected as flow by the OCTA algorithms. Thus, flow signal in the various retinal plexuses could not be cleanly separated. This limitation was overcome when we developed a projection-resolved OCTA algorithm that could distinguish in-situ flow from projected flow. With projection-resolved OCTA, it’s possible to resolve up to four vascular plexuses in the retina6 (See Figure 2).
In the peripapillary region, glaucoma primarily affects the nerve fiber layer plexus, which perfuses the NFL. In the macula, glaucoma affects both the NFLP and the ganglion cell layer plexus, which perfuses the ganglion cell layer. Together, the NFLP and GCLP constitute the superficial vascular complex. Thus, focusing on the peripapillary NFLP and macular SVC enhances the visualization of focal glaucomatous defects and improves diagnostic accuracy. For example, we’ve shown that the macular SVC vessel density has better diagnostic accuracy than the all-plexus retinal vessel density.4
Why Use OCT Angiography?
According to the American Academy of Ophthalmology’s IRIS Registry, OCT has already overtaken visual fields as the more frequently used method for glaucoma evaluation. Structural OCT measurements of the peripapillary NFL and macula ganglion cell complex are now part of standard glaucoma management. Since OCTA measurement of peri-papillary NFLP vessel density is highly correlated with NFL thickness, and macular SVC vessel density is highly correlated with GCC thickness, why do we need to invest in OCTA machines? Why not just stick with the more familiar OCT technology we already have?
The answer is that OCTA has additional value, both in the very early and late stages of glaucoma.
Two clinical studies have shown that OCTA can detect early pre-perimetric glaucoma better than structural OCT.7,8 Why would this be the case? I believe it’s because OCTA detects both dysfunctional (sick) and lost (dead) ganglion cells, while structural OCT only detects lost ganglion cells. I speculate that in very early glaucoma, sick, dysfunctional ganglion cells have lower metabolism that leads to reduced capillary density. This reduced density is detectable by OCTA, prior to the apoptosis these ganglion cells undergo and the
subsequent thinning of NFL and GCC that can be detected by structural OCT. Thus, by adding OCTA to our diagnostic toolkit, we can detect glaucoma earlier and intervene in a timelier fashion.
Other studies have shown that OCTA parameters correlate better with visual field parameters than structural OCT parameters such as NFL thickness.3,9 This is partly due to the lessening of the “floor effect” with OCTA measurements. The floor effect describes the fact that while NFL thickness is correlated with visual field mean deviation in early glaucoma, it reaches a floor value in moderate glaucoma, and then doesn’t decrease any further in advanced glaucoma. This limits the utility of
NFL thickness for monitoring glaucoma progression in the moderate and advanced stages.10 While vessel density also eventually reaches a floor, it appears to do so only in advanced glaucoma. Thus OCTA has the potential to improve the monitoring of glaucoma in the moderate to advanced stages. (A large longitudinal study is needed to demonstrate this potential.)
 |
|
|
Simulating Visual Fields
Given that OCTA parameters correlate well with visual field data over a wider range of disease severities, it has the potential for simulating actual visual field results. This would be a boon to the many patients who cannot reliably perform visual field tests. And the fact is—your patients hate taking visual field tests.
| These metrics are now becoming available on commercial OCT machines as well. |
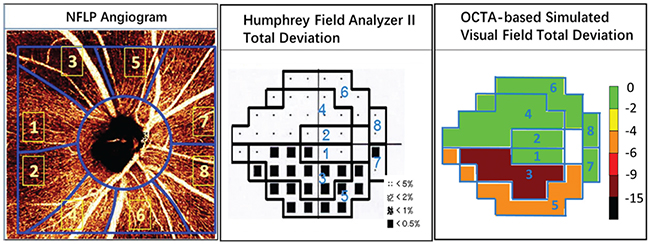
We’ve developed a method of sectorwise visual field simulation using peripapillary NFLP OCTA results (See Figure 4, p. 75). The results show good correlation in the early and moderate stages of the disease. The simulated visual field sectors could also be summed into a mean deviation parameter: NFLP_MD. NFLP_MD is highly correlated with VF_MD, but has better diagnostic accuracy and reproducibility. Thus, the simulated visual field might perform better than an actual visual field for monitoring glaucoma progression—in addition to being more painless and convenient. (We caution that this method of visual field simulation is not FDA-cleared or commercially available, and a large longitudinal study is needed to validate its utility.)
The variability of visual field testing is not just inconvenient, it could result in unnecessary surgery, or delayed treatment and loss of vision. Statistical analyses11 have shown that for a glaucomatous eye with MD worsening at a rate of -1 dB/year, testing every six months over four years is required for the trend to become statistically significant (90 percent power, p<0.05), at which time the mean deviation would already be 4 dB worse. This represents a 60-
percent loss of retinal sensitivity be-fore a clinician has firm evidence to support intensifying treatment! A more reproducible, objective method for monitoring glaucoma progression could detect significant progression sooner, thus allowing more timely intervention to save vision.
 |
|
|
OCTA Availability
The results we’ve published were achieved using capillary and vessel-density algorithms developed in our laboratory and reading center. However, these metrics are now becoming available on commercial OCT machines as well, so it’s possible to get peripapillary disc scans and macular scans using commercially available OCT angiography systems. That means that this isn’t limited to the laboratory; glaucoma specialists can now use these scans to monitor their glaucoma patients.
For example, the AngioVue, which runs on the Avanti OCT system from Optovue, has a good set of metrics for quantifying the peripapillary NFLP and the macular SVC. On the AngioVue peripapillary scan, the NFLP is called the radial peripapillary capillary, or RPC. We recommend using the 4.5 x 4.5-mm high-definition OCTA scan for the disc region, and the RPC density, to evaluate glaucoma. For the AngioVue macular scans, you should use the larger, 6 x 6-mm
HD scan pattern and look at what they call the superficial retinal vessel density. The current AngioVue superficial retinal slab corresponds exactly to the SVC.
Zeiss’s Cirrus HD-OCT platform has the AngioPlex OCT angiography software. You can use the AngioPlex 6-mm macular scan to evaluate glaucoma. That system can analyze superficial retinal vessel density, which they call perfusion density. To the best of my knowledge, that system currently doesn’t have specific software to analyze the peripapillary NFLP around the disc, but I believe it’s possible to export the images and process them for this purpose. Heidelberg has an OCT angiography module for Spectralis that was introduced at the American Academy of Ophthalmology meeting in 2018, and Topcon has developed swept-source OCT angiography software called OCTARA (pending FDA clearance) that works with its Triton OCT platform.
Thus, the OCTA options for the glaucoma specialist will expand in the near future. As the possibility of detecting and monitoring glaucoma with this technology becomes apparent, all of these systems will undoubtedly offer software updates, allowing clinicians to perform these types of analyses. REVIEW
Dr. Huang is the Peterson Professor of Ophthalmology and a professor of biomedical engineering at Oregon Health and Science University in Portland. Dr. Jia is the Weeks Professor of Ophthalmology and an associate professor of biomedical engineering at OHSU. They report financial interests in Optovue. Dr. Liu is a research associate at OHSU.
1. Jia Y, Tan O, Tokayer J, et al. Split-spectrum amplitude-decorrelation angiography with optical coherence tomography. Opt Express 2012;20:4:4710-4725.
2. Jia Y, Wei E, Wang X, et al. Optical coherence tomography angiography of optic disc perfusion in glaucoma. Ophthalmology 2014;121:7:1322-1332.
3. Liu L, Jia Y, Takusagawa HL, et al. Optical coherence tomography angiography of the peripapillary retina in glaucoma. JAMA ophthalmology 2015;133:9:1045-1052.
4. Takusagawa HL, Liu L, Ma KN, et al. Projection-resolved optical coherence tomography angiography of macular retinal circulation in glaucoma. Ophthalmology 2017;124:11:1589-1599.
5. Wang Y, Bower BA, Izatt JA, Tan O, Huang D. In vivo total retinal blood flow measurement by Fourier domain Doppler optical coherence tomography. J Biomed Opt 2007;12:4:041215.
6. Campbell JP, Zhang M, Hwang TS, et al. Detailed vascular anatomy of the human retina by projection-resolved optical coherence tomography angiography. Sci Rep 2017;7:42201.
7. Akil H, Huang AS, Francis BA, Sadda SR, Chopra V. Retinal vessel density from optical coherence tomography angiography to differentiate early glaucoma, pre-perimetric glaucoma and normal eyes. PLoS One 2017;12:2:e0170476.
8. Yarmohammadi A, Zangwill LM, Manalastas PIC, et al. Peripapillary and macular vessel density in patients with primary open-angle glaucoma and unilateral visual field loss. Ophthalmology 2018;125:4:578-587.
9. Yarmohammadi A, Zangwill LM, Diniz-Filho A, et al. Relationship between optical coherence tomography angiography vessel density and severity of visual field loss in glaucoma. Ophthalmology 2016;123:12:2498-2508.
10. Zhang X, Dastiridou A, Francis BA, et al. Comparison of glaucoma progression detection by optical coherence tomography and visual field. Am J Ophthalmol. 2017;184:63-74.
11. Wu Z, Saunders LJ, Daga FB, Diniz-Filho A, Medeiros FA. Frequency of testing to detect visual field progression derived using a longitudinal cohort of glaucoma patients. Ophthalmology 2017;124:6:786-792.


