Refractive screening technology has undergone a number of advances, but weeding out poor candidates in an effort to avoid postoperative ectasia remains a challenge. Gaurav Prakash, MBBS, MD, FRCS (Glasg.), an assistant professor of ophthalmology at the University of Pittsburgh School of Medicine, says the ideal detection method isn’t available yet. “Until you have a very evolved clinical sign, it’s difficult to predict how a tissue will behave when you do laser,” he says. “We’re looking at a combination of biomechanical indices and corneal shape.”
“If we had a reliable system that could say with certainty that a cornea was normal or abnormal, we could exclude all patients at risk for ectasia and avoid excluding those who have some slightly worrisome findings on examination but are otherwise good candidates,” says Edward Manche, MD, a professor of ophthalmology at Stanford University School of Medicine and director of Cornea and Refractive Surgery at the Stanford Eye Laser Center . “As it is, and in my practice, we probably disqualify more patients than actually should be disqualified when we err on the side of caution.”
In this article, surgeons discuss ectasia risk and offer strategies for screening and avoiding common pitfalls of data interpretation.
Ectasia Susceptibility
“We’ve undergone a paradigm shift from detecting mild keratoconus to understanding ectasia susceptibility, which is not the same thing,” says Renato Ambrósio Jr., MD, PhD, director of Cornea and Refractive Surgery at the Instituto De Olhos Renato Ambrósio/Visarerio Refracta Personal Laser in Rio De Janeiro and professor of ophthalmology at Federal University of the State of Rio De Janeiro and of São Paulo, Brazil.
He explains that ectasia develops due to biomechanical failure according to innate corneal properties and environmental factors such as laser vision correction and eye rubbing.1 Even though genetics determines the corneal structure, the environment plays a major role. Biomechanical decompensation begins with focal reduction in elasticity followed by a cycle of increased strain, stress redistribution and focal steepening and thinning.2
Some of the modalities in use today for multimodal imaging in refractive screening include Placido disc-based topography, 3D Scheimpflug tomography, segmental tomography with OCT or very high-frequency ultrasound, biomechanical measurements and wavefront analysis. “All of the data from these devices will enhance our ability to characterize ectasia susceptibility and select the best candidates for LVC,” says Dr.
Ambrósio, who with Michael W. Belin, MD, FACS, co-developed the Belin/Ambrósio enhanced ectasia display, software for early ectasia detection integrated with Pentacam (Oculus), that combines elevation-based and pachymetric corneal evaluation into one display. Dr. Ambrósio believes that artificial intelligence will play a major role in the future of screening, considering the amount of data generated by such modalities.
 |
|
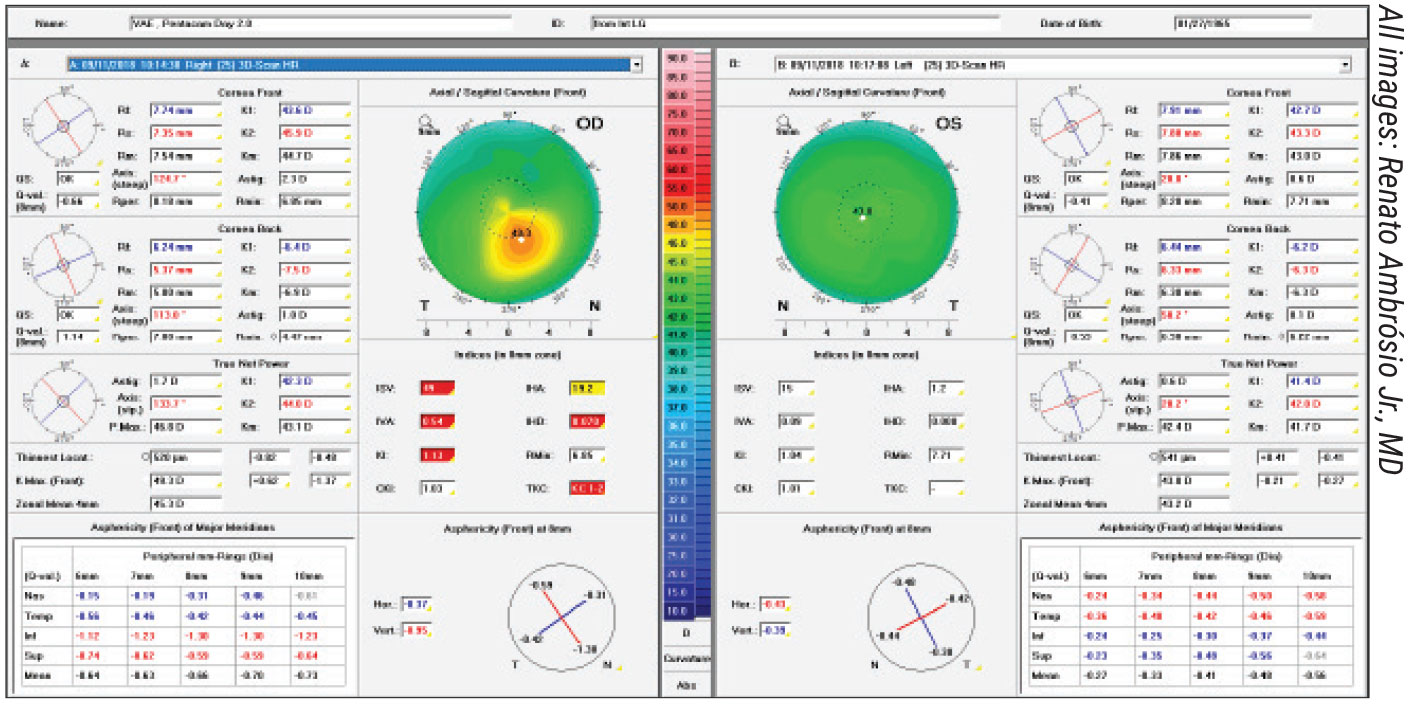
Figure 1. Patient is a 53-year-old male interested in refractive surgery who reports gradual vision loss OD. UDVA is 20/60, J3 OD and 20/30, J3 OS. Manifest refraction is -0.75 -2.25 x 25 degrees, giving 20/20-1 OD; and -0.5 -0.75 x 120 degrees, giving 20/15 OS Add. +2.75, J1. He has mild keratoconus in the right eye and normal topography in the left eye. |
“Understanding the impact LVC procedures have on the biomechanical susceptibility of the cornea to progressive ectasia is key,” he adds. “A fundamental concept is to accept that any cornea may undergo biomechanical decompensation and ectasia progression.”
When assessing a patient’s risk for ectasia, J. Bradley Randleman, MD, a professor of ophthalmology at the Cole Eye Institute, Cleveland Clinic, looks at corneal imaging first and then reviews patient-related details, including age and refractive error. He calculates the predicted residual stromal bed thickness (greater than 300 µm is considered low risk and less than 240 µm, high risk) and percent tissue altered, and then re-reviews all available corneal imaging with these patient-related factors in mind.
“I do this because I want to assess the normality of corneal imaging before being swayed by patient factors, and then I want to re-evaluate the imaging within the context of these factors,” he says. “The younger the patient, the more concerned I am about any subtle asymmetry in their imaging.”
Some patients may still develop ectasia, even when you leave behind sufficient stroma. “In my practice, we generally avoid patients with less than 500 µm of stroma preoperatively,” says Dr. Manche. “In those cases, we almost always default to PRK. A thickness of 250 µm is the historically acceptable posterior stromal thickness to leave, but I prefer to leave at least 310 µm so there’s room in case I need to do enhancement surgery. If we have to remove more tissue, then I’ll consider lens-based surgery or surface ablation with PRK.”
“The percentage of tissue altered shouldn’t be significantly high,” Dr. Prakash adds. “Marcony Santhiago, MD, PhD, proposed this metric for refractive surgery screening in 2014.3 He found that the percentage of tissue altered, or flap thickness plus ablation depth, divided by preoperative central corneal thickness (= FT + AB =[FT+AB]/CCT), has a strong relationship with ectasia development in eyes with normal topography. It’s recommended that a PTA of 40 percent or more be considered for higher-risk patients.”
Dr. Randleman’s Ectasia Risk Score System was built based on subjective placido-based curvature analysis and patient-related factors. The ERSS takes into account topography pattern, residual stromal bed thickness, age, corneal thickness and manifest refraction to produce a risk score ranging from zero to four, with higher scores indicating greater risk.
“I still utilize all of the factors that went into the ERSS, at least conceptually, but I now have additional data available that I use for all screenings,” Dr. Randleman says. “I find regional pachymetry maps to be particularly useful and better than single-point thickness metrics. I also find elevation maps to be complimentary to curvature maps. If, for instance, there’s a major focal curvature change but nothing on anterior elevation, then I look closely to see if there’s some corneal process causing this finding, such as EBMD or another scarring process. I do review the posterior elevation maps as well, but I’ve found these to be less predictive for risk than anterior curvature and elevation.”
“Dr. Randleman has done remarkable work on understanding ectasia,” Dr. Ambrósio says. “He’s commended to be the first to integrate different parameters for evaluating ectasia risk. A very important contribution from his scale was age. Age is a surrogate for corneal biomechanical properties. We have many studies in vitro and in vivo demonstrating this. However, my major concern with his scale is that he uses forme fruste keratoconus as a topographic criterion. FFKC is an abortive form of keratoconus that may or may not progress to the full-blown clinical condition. While the 2015 Global consensus shows no agreement on the definition of FFKC, there was consensus that keratoconus is bilateral, and that ectasia may occur unilaterally due to biomechanical stress.
“I’d define FFKC as a cornea with high ectasia susceptibility,” he continues. “These eyes have normal topography, but the fellow eye has clinical ectasia. However, we must recognize that some of these very asymmetric cases are indeed unilateral (not keratoconus) ectasia cases. Ultimately, I agree that FFKC is the most important risk factor for developing progressive ectasia after LVC; the problem is how to define and how to identify FFKC.4 Topography enhances the sensitivity of detecting abnormalities in patients with good distance-corrected vision and normal biomicroscopy, but often it’s not enough to pick up subclinical disease. We need to go beyond, not over, front surface curvature. This means adding more data from diagnostic tests, such as tomographic and biomechanical data.”
Biomechanical Challenges
 |
|
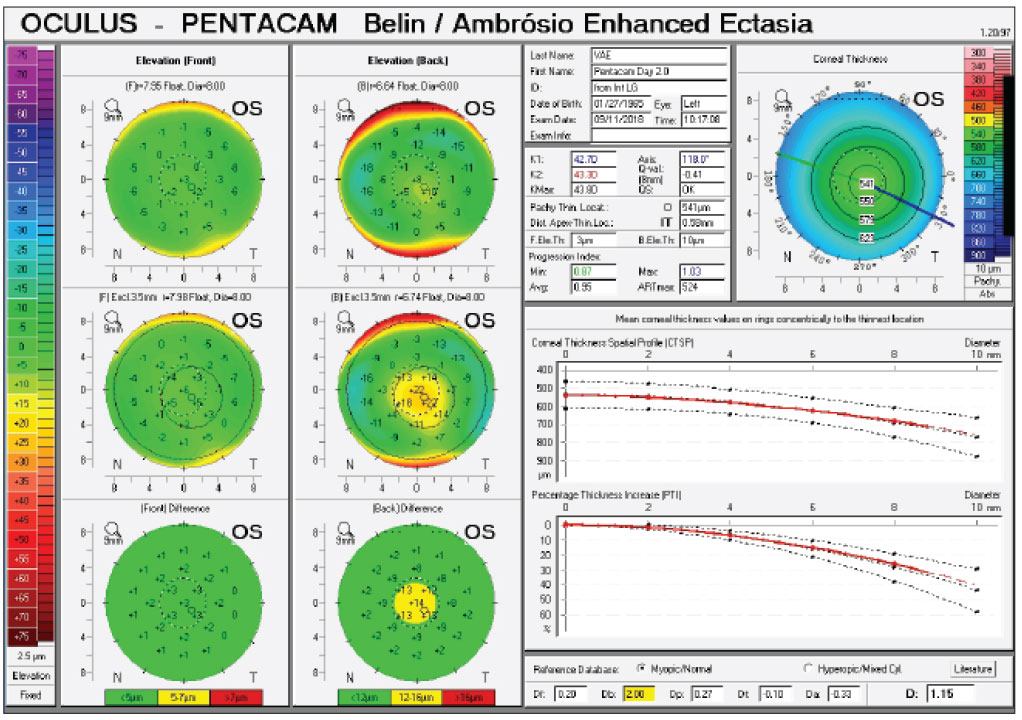
Figure 2. An elevation and pachymetric assessment (Belin/Ambrósio Enhanced Ectasia Display) of the left eye of the same patient from Figure 1, showing mild elevation change and borderline tomography. Elevation maps are viewed by comparing the data to a standard reference surface. Physicians say that raw elevation data on its own doesn’t have enough surface variability for a clinician to easily distinguish normal from abnormal corneas on qualitative inspection. Subtracting a reference surface exaggerates the differences.8 |
Biomechanical properties of the cornea aren’t easy to analyze. “We’ve done work with different non-contact tonometers,” Dr. Ambrósio says. “Our work on biomechanical assessment started in 2003 with a prototype of ORA (Reichert), which documents corneal deformation caused by an air puff with a single-point reflex. This work demonstrated the clinical relevance of such measures for ectasia detection. A few years later, we collaborated on the development of the Corvis Scheimpflug technology (Oculus). The Corvis ST provides an 8-mm Scheimpflug image so you can see corneal deformation in more detail. In addition, Corvis ST and Pentacam are from the same company, so the generated information can be integrated through artificial intelligence algorithms, such as the Ambrósio, Roberts and Vinciguerra (ARV) Display (Figure 3).5
“One of the biggest problems with biomechanics currently is that we have a large range of normal,” says Dr. Prakash. “When you have a large distribution of biomechanical properties, affected by corneal thickness, genetics and ethnicity, it’s difficult to define what’s normal and abnormal, especially in subtle cases right on the decision boundary.
“It’ll be interesting to see if in future there will be robust and more universal criteria that combine biomechanics with tomography on multiple devices,” he continues. “As of now, if you have keratoconus, the biomechanics will be altered and the cornea will have different indices compared to normal, but we’re still looking for variation.”
Brillouin Microscopy
An emerging technology for analyzing corneal biomechanics is Brillouin optical microscopy, a type of optical elastography that uses low-power, near-infrared laser to determine mechanical compressibility of tissue by analyzing the return signal spectrum with confocal spectrometry.6 “Brillouin microscopy is a fascinating technology that has great potential,” says Dr. Randleman. “We’re starting our trials to measure patients before and after laser vision correction (PRK, LASIK and SMILE) to see what differences we’re able to detect in their corneas regionally. We’re also evaluating patients with different states of keratoconus to see how these eyes differ from normal corneas.
“The Brillouin technique is non-invasive, so it can be repeated multiple times as needed, and it’s the first technology that can provide a picture of what’s occurring focally, both in terms of location on the cornea and also with respect to depth within the cornea,” he continues. “This means we can detect where in the cornea the differences are occurring. This capability is different from those of Corvis or the ORA, which can only provide a global sense of corneal stiffness, and both require an air puff impulse that can generate variable responses in patients.
“Brillouin is still in the early research phases,” he notes, “but it could become a major part of preoperative evaluation and procedure selection based on the combination of the patient’s individual biomechanical profile and the relative impact of different LVC options.”
In the meantime, Dr. Manche says he screens all potential refractive surgery patients using wavefront aberrometry, in addition to topography and tomography. “We’re using the iDesign 2.0 (Johnson & Johnson Vision), which has been available since 2018,” he says. “It has five integrated measurements including wavefront aberrometry, wavefront refraction, full-gradient corneal topography, keratometry and pupillometry. We also perform pachymetry, both optical and ultrasonic, when screening patients.”
Epithelial Mapping
Dr. Randleman says a useful technology that’s arisen over the past decade is epithelial thickness mapping in the form of either very high-frequency digital ultrasound (VHFDU), or optical coherence tomography. “In our practice we use OCT-based total and epithelial thickness maps for all of our refractive screenings, and I find this data to be remarkably useful,” he says. “The pioneering work by Dan Reinstein, MD, on epithelial remodeling (using VHFDU) and then the development of this mapping capability using OCT by David Huang, MD, PhD, has revolutionized our understanding of early, subtle changes that can clarify borderline screening patients.
“As an example, if there’s focal steepening on anterior curvature imaging that coincides with epithelial thinning, that’s a red flag for me, and I avoid surgery in those cases,” he notes. “Alternatively, if focal steepening is accompanied by focal epithelial hypertrophy, I have less concern and often will offer patients with those findings corneal refractive surgery.
“The normal cornea has low thickness variation across the center, but also tends to exhibit mild inferior hypertrophy,” he says. “Focal thinning isn’t typical, and if this finding is seen in conjunction with corneal steepening, this is particularly concerning. Alternatively, focal steepening coincident with focal epithelial hypertrophy is a comforting finding.”
Strategies for Success
Avoiding patients who are likely to develop postoperative ectasia is key, but it’s not always easy to identify them, especially in borderline cases. Here are some strategies for sharpening your screening process:
• Look at as many scans as possible to hone your interpretive skills. “The best way to get through the learning curve of understanding topography and tomography is to see as many scans as possible,” says Dr. Prakash. “When you’re working in a single surgery practice or a small practice, this might be difficult, so I ask people to look at resources such as JCRS, clinical cases, sessions or online repositories of topography. Try to assess why the topography is normal or abnormal. It’s all about repetition.”
• Don’t compare data from two different devices directly. A large part of diagnostic data interpretation comes down to knowing how to use a specific device and how to understand and compare the outcomes of that device, says Dr. Prakash. “Say you use Pentacam, and a patient comes to you with scans taken with the Cirrus (Zeiss) or the Atlas (Zeiss),” he says. “It’s been clinically proven that you can’t compare the data directly between two different devices. You have to either have the conversions in your head or redo the scans. This is especially important when looking at borderline scans.”
• Stay alert for off-center corneal thinning on pachymetry. “The normal cornea is thinnest centrally and has a relatively predictable progression of thickening towards the periphery,” Dr. Randleman explains. “If the thinnest point is significantly deviated from the center, and/or if there’s minimal thickness progression towards the periphery, these are both concerning findings.”
• Pay attention to the scale when interpreting topographic maps. “Evaluating corneal front surface topography maps is subjective,” says Dr. Ambrósio. “The first thing you should do when evaluating a topography map, or any kind of map, is to look at the scale bar. Changing the scale may completely change your subjective interpretation. Try to standardize the scales and parameters you use.”
• Be aware of your subjective interpretation. It’s important for clinicians to be as objective as possible when interpreting scans and data, to compensate for the inherently subjective nature of topographic data interpretation. Dr. Ambrósio advises a thorough understanding of the rationale for statistical analysis, sensitivity, specificity and accuracy, when comparing variables and picking the best parameters.
He notes that understanding how certain maps are constructed—such as curvature maps, which are divided into axial and tangential maps, each with their unique sensitivities and detection strengths—will also alert you to possible errors in subjective classification. “Be sure you know which map you’re looking at,” he says. “A tangential map is highly sensitive because it’s aim is to identify abnormalities, but this also means it’s noisier than an axial map.”
He and his colleagues, including Dr. Randleman, conducted a study on the subjective variability of classification. “We had 11 experts classifying 25 preoperative axial curvature maps using the Ectasia Risk Scoring System,” he says. “First, they reviewed each case represented with an absolute scale; three months later they reviewed the same cases with a normative scale, both times masked to the patient group. Interestingly, eight out of 11 experts (73 percent) reported statistically higher scores when using the normative scale. The level of variability was more than 60 percent.” Of all 550 topographic analyses, the same classification of the two scales was reported in 121 case pairs (44 percent).7
• Don’t rely solely on algorithms and metrics. Many corneal imaging devices have AI analysis built in which can assign a score based on the percentage of agreement with keratoconus, notes Dr. Manche. He says this can be very helpful for clinicians just starting out, but adds that “it’s always good to confirm the AI analysis with other diagnostic testing.”
Likewise, Dr. Ambrosio says that though objective data such as that from the Belin/Ambrósio display are invaluable when evaluating a patient, they’re not replacements for physicians’ cognition. “You can make clinical judgments based on these data, but don’t let the data dictate what you do,” he advises. “Understand the limitations of your diagnostic tools and what you’re trying to achieve with the data.”
“Screening metrics are attractive because they take a number of factors and reduce them to a single value,” Dr. Randleman says. “Unfortunately, the attractiveness of metrics doesn’t always convey their underlying value or shortcomings. Regarding the Belin/Ambrosio display, I haven’t found any of the available metrics to be particularly clarifying in screening, and unfortunately they can be misleading. I have, for instance, reviewed a number of cases that unfortunately developed ectasia after LASIK where none of the metrics on the enhanced ectasia display were reported as abnormal. I caution everyone to review any specific screening metrics but not rely upon them more than careful interpretation of the raw data, because no specific metrics have been shown to be more accurate than this approach at this time.”
Artifacts
 |
|
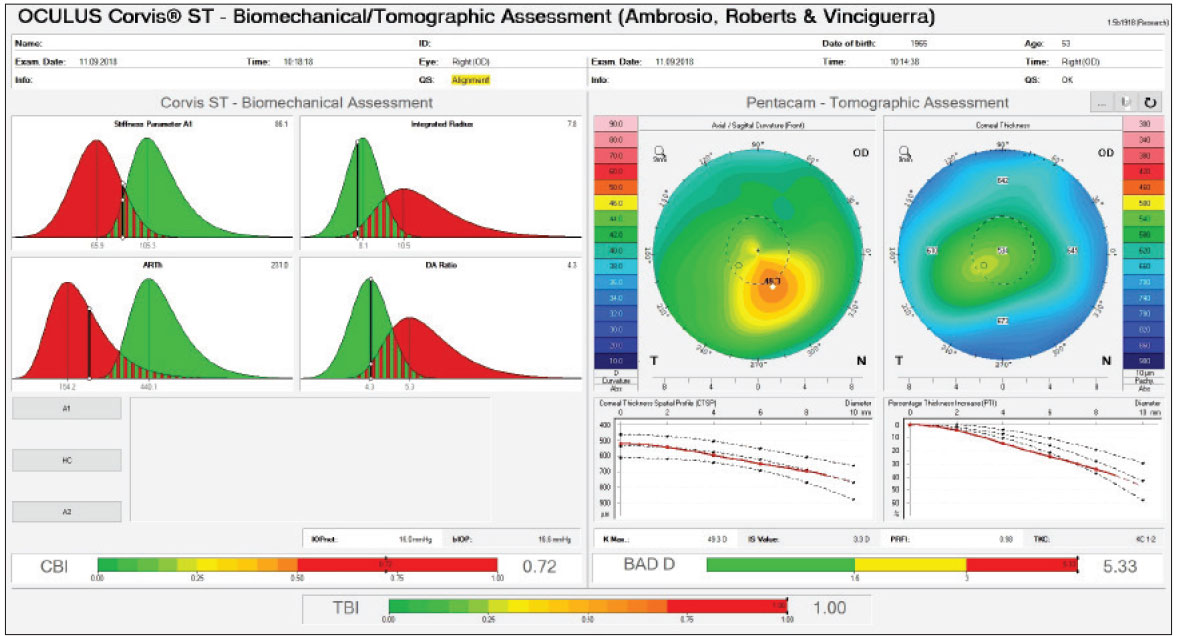
Figure 3. A biomechanical/tomographic assessment (Ambrósio, Roberts & Vinciguerra Display) of the same patient’s right eye from Figures 1 and 2, showing abnormal tomography and biomechanics. |
Artifacts will skew your results. “Your interpretation is as good as the data you get,” says Dr. Prakash. “We use the phrase: “Garbage in, garbage out.” Here are some artifacts to watch out for:
• Moving and alignment artifacts. Today’s devices are much faster than their predecessors, taking about 15 to 20 seconds to complete a scan, but even so—if a patient isn’t able to sit still for the scan, that movement may affect the scan quality. “Not looking straight at the light, blinking too much and improper head alignment can also cause artifacts,” Dr. Prakash says. “I always recommend physicians look at the scan and the eye together. Don’t treat the scan, treat the eye. And don’t be afraid to redo a scan if it’s not good quality.”
• A suboptimal ocular surface. Dr. Prakash says that dry eye can result in false positives such as the appearance of steeper or flatter areas of the cornea that don’t actually exist. “Scars can also change how the cornea looks, so keep that in mind when looking at your scans,” he adds.
“A good slit lamp examination of the lids and lashes as well as the ocular surface, including tear-film breakup time and corneal staining with vital dyes such as fluorescein and lissamine green, will help you rule out patients with dry eye,” Dr. Manche says. “Look for MGD, blepharitis and inflammation.”
• Contact lens wear. Previous contact lens wear can cause the cornea to look more regular or irregular than it truly is, so ensure your patient has discontinued wearing their contacts for a period of time before performing any scans: about one week for soft contact lenses and two weeks for toric lenses. For rigid gas-permeable lenses, one month of discontinuation per decade of wear is the rule of thumb, according to experts. “This is especially important for a long-term ortho-K wearer, since those lenses flatten the cornea,” Dr. Manche says. “You need to follow those patients for a fairly long period of time with serial corneal topographies to ensure the induced flattening has resolved.”
The Final Frontier: Genetic Screening
“Keratoconus is multifactorial and caused by multiple genes, so it’s not easy to detect,” says Dr. Manche. “However, there’s a new genetic test for keratoconus out now from Avellino Labs.” (AvaGen was released in the U.S. in June 2021.)
Eric Donnenfeld, MD, a clinical professor of ophthalmology at New York University Medical Center, partner at Ophthalmic Consultants of Long Island and consultant for Avellino Labs, says this is the first DNA test available for keratoconus. “There are about 50 different genes involved in the development of keratoconus,” he says. “The test examines 75 keratoconus-related genes with more than 2,000 variants and stratifies the risk of developing keratoconus over a lifetime based on individual genes and on the combination of genes a patient has. It can also diagnose other corneal dystrophies such as granular, lattice, Reis-Bucklers and Theill-Behnke dystrophies.”
He says he’s just added this genetic test to his office’s armamentarium. “If I see mildly abnormal topography, having a stratified risk score reflecting a patient’s chance of developing keratoconus makes me much more comfortable in my decision as to whether they should have LASIK or PRK or just be followed. I also use this test for patients who have family members with keratoconus and for children of parents with keratoconus. The key to eradicating keratoconus is diagnosing it as early as possible, so patients can have cross-linking performed at a younger age.”
Dr. Manche is a consultant for Avedro/Glaukos and Johnson & Johnson Vision and receives research support from Alcon, Avedro, Zeiss, Presbia, Johnson & Johnson Vision and Novartis. He holds equity in RxSight and Placid0. Dr. Ambrósio is a consultant for Alcon/WaveLight, Allergan, Essilor, Genom/União Química, Ofta Vision Health, Mediphacos, Oculus and Zeiss. Dr. Donnenfeld is a consultant for Avellino Labs and Glaukos. Dr. Prakash and Dr. Randleman have no related financial disclosures.
1. Ambrósio Jr R. Violet June: The global keratoconus awareness campaign. Ophthalmol Ther 2020;9:685-88.
2. Roberts CJ and Dupps Jr WJ. Biomechanics of corneal ectasia and biomechanical treatments. J Cataract Refract Surg 2014;40:6:991-98.
3. Santhiago MR, et al. Association between the percent tissue altered and post-laser in situ keratomileusis ectasia in eyes with normal preoperative topography. Am J Ophthalmol 2014;158:1:87-95.
4. Esporcatte LPG, Salomão MQ, Lopes BT, et al. Redefining forme fruste keratoconus as ectasia susceptibility. Acta Sci Ophthalmol 2021:4:4:177-86.
5. Ambrósio R Jr, Lopes BT, Faria-Correia F, et al. Integration of scheimpflug-based corneal tomography and biomechanical assessments for enhancing ectasia detection. J Refract Surg 2017;33:7:434-43.
6. Yun S, Chernyak D. Brillouin microscopy: Assessing ocular tissue biomechanics. Curr Opin Ophthalmol 2018;29:4:299-305.
7. Ramos IC, Correa R, Guerra, et al. Variability of subjective classifications of corneal topography maps from LASIK candidates. J Refract Surg 2013;29:11:770-75.
8. Belin MW, Khachikian SS. Keratoconus/ectasia detection with the Oculus Pentacam: Belin/Ambrósio enhanced ectasia display. In: New Advances and Technology with Pentacam. Oculus 2008:3-7.