Optical coherence tomography enables clinicians to detect structural damage in their glaucoma patients. It’s become a standard tool for diagnosing and monitoring the disease—but it’s not infallible. In this article, glaucoma specialists share their tips for detecting progression on OCT and avoiding being fooled by artifacts for optimal interpretability.
OCT Overview
OCT is most useful in glaucoma suspects and in cases of mild to moderate disease. In early stages, the peripapillary nerve fiber layer is the most sensitive parameter, explains David Huang, MD, PhD, associate director and director of research at the Casey Eye Institute, Peterson Professor of Ophthalmology and a professor of biomedical engineering at the Oregon Health & Science University in Portland.
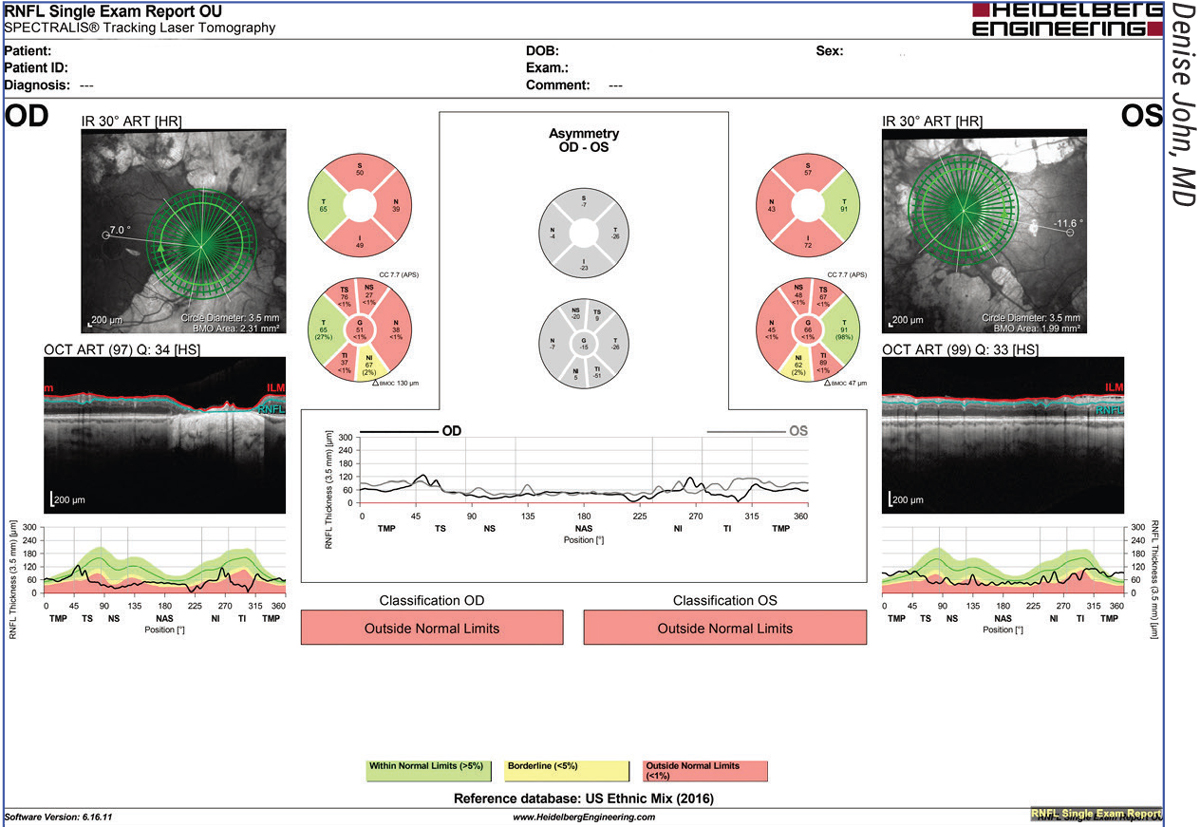 |
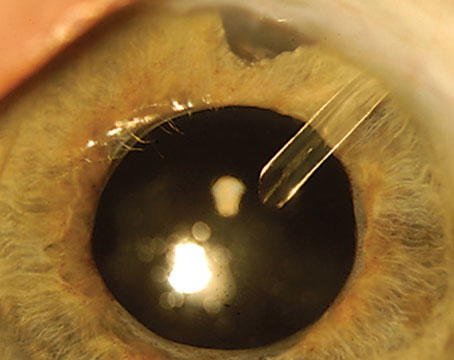
| Figure 1. Example of a red-disease artifact due to segmentation error on OCT in a 57-year-old Caucasian male with a history of proliferative diabetic retinopathy with extensive PRP and ocular hypertension. The infrared image (top right) for the right eye shows the calculation circle passes through the area of peripapillary atrophy inferior temporal and inferior nasal. Since there’s no RNFL tissue in this region, the TSNIT profile (bottom right) shows a zero RNFL thickness. Also, note thinning of the RNFL in all the quadrant and sector classification charts (middle) and the TSNIT profiles (bottom right and left), except temporally due to PRP. |
He notes that the macular ganglion cell complex is another key parameter. A 2020 study reported that, compared to other macular thickness measurements such as full macular, GCIPL, GCL and outer retinal layer thickness, GCC measurements were most likely to detect structural worsening along the glaucoma severity spectrum.1 “Macular changes start slightly later and last longer,” Dr. Huang says. “They’re a complement to the NFL because changes in mild to moderate perimetric glaucoma will be more detectable.”
Dr. Huang says he generally looks at the global average thickness in those structures. “You can also look at the sectors, but of course, that’s a little noisier,” he says. “Sector change may be more useful in patients with a more focal type of glaucoma where damage is concentrated in one sector or one hemisphere of the macula.”
OCT is less useful in later stages of the disease when the device runs into the “floor effect,” when RNFL loss is no longer detectable at about 40 to 45 µm. At this point, clinicians may feel a false sense of security upon seeing very little structural change.
“Due to the presence of blood vessels and glial tissue, the RNFL thickness should never be zero—if it is, then there’s a segmentation error,” notes Denise John, MD, FRCSC, a clinical assistant professor of ophthalmology and visual sciences at the Kellogg Eye Center and chief of ophthalmology at the VA Ann Arbor Healthcare Systems in Michigan.
When Dr. John assesses the average RNFL thickness in her patients, she looks for a change greater than 5 µm in average RNFL and/or 10 µm in the sectors, especially in the inferior and superior sectors which are commonly affected by glaucoma. She confirms any concerns about progression with a repeat scan.
The American Academy of Ophthalmology’s Preferred Practice Patterns recommends acquiring an OCT at least once a year. “I typically get an OCT annually for glaucoma suspects and those with stable, mild disease, and I may get an OCT as often as twice per year in those with moderate disease, depending on the stability of the glaucoma,” Dr. John says.
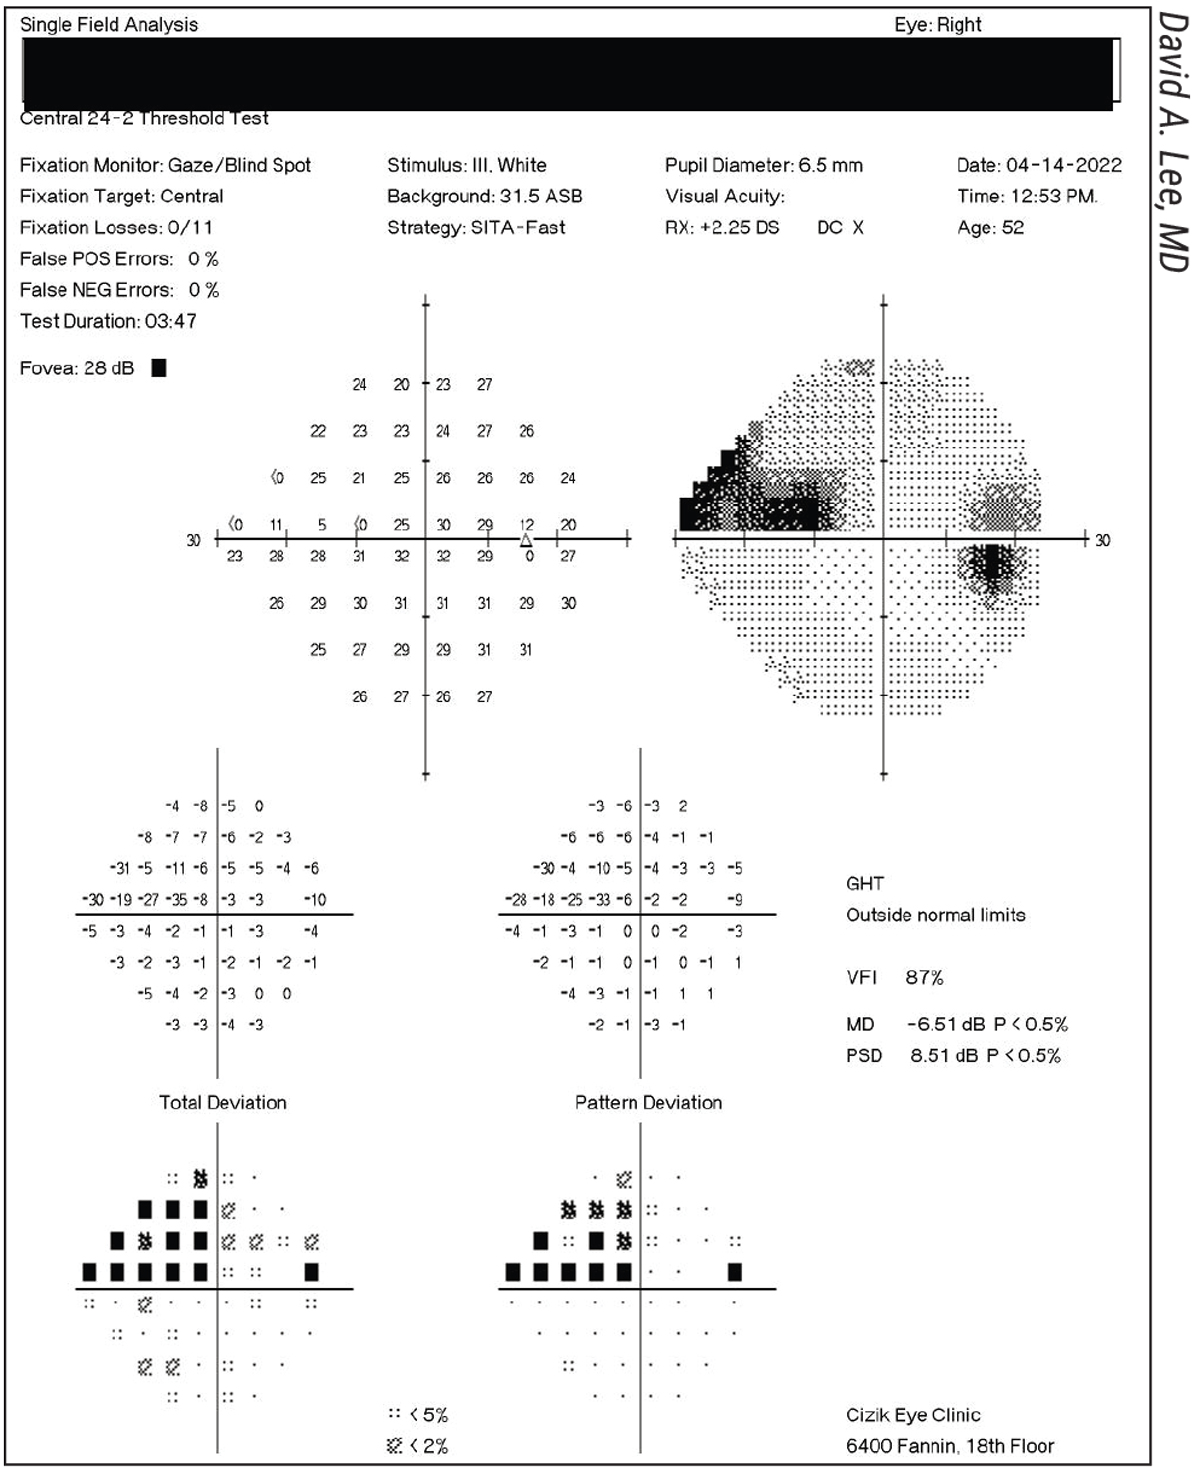 |
| Figure 2. This patient has open-angle glaucoma in both eyes; a series of OCT, HVF and optic disc photos have been stable for several years. The right eye has an inferior RNFL defect with a corresponding HVF superior nasal step and an inferior notch on the optic disc photos. The left eye is relatively normal in all three tests over time. |
“Unfortunately, one of the drawbacks of OCT is that it doesn’t image any hemorrhages on the nerve,” says David A. Lee, MD, MBA, a clinical professor at the Cizik Eye Clinic in the Ruiz Department of Ophthalmology and Visual Science at McGovern Medical School in Houston. “One of the other indicators of progression is bleeding on the optic nerve tissue. That’s why looking at the optic nerve directly under the microscope or ophthalmoscope or by taking color photographs (stereoscopic optic disc photographs) is still useful, because we can see and document hemorrhages with photography where they wouldn’t otherwise show up on OCT.”
Angiographic OCT
OCT-angiography is a non-invasive newcomer to glaucoma imaging that provides both a qualitative and quantitative assessment of the retinal and optic nerve head vasculature. It’s a good complement to visual field tests and OCT, experts say.
Dr. Huang is currently managing a longitudinal, NEI-funded study on both structural OCT and OCTA, with the goal of improving the diagnostic sensitivity of both modalities—especially for early glaucoma—as well as improving the ability to monitor progression over time. He says that though OCTA isn’t widely used in the clinic now, down the road, a combination of structural OCT and angiographic OCT may aid clinicians in detection of disease and progression, and adjustment of therapy.
“Structural OCT and OCTA are important at different stages of the disease,” he explains. “Structural OCT is sensitive to change in the early stages, such as pre-perimetric or early-perimetric glaucoma, but it runs into the floor effect between moderate and advanced glaucoma. Even in moderate glaucoma, the NFL reaches a low point where it doesn’t really change in terms of micrometers of thickness, so OCT is then no longer sensitive to progression. That’s where OCTA could take over. Superficial vessel density loss in the peripapillary and macular areas changes gradually, and OCTA still has enough dynamic range in moderate and severe disease to detect change.”
Speed of Progression
Dr. Huang says you have to be aware of the stage of the disease to meaningfully interpret the speed of progression. “If you follow a patient for a long time, you’ll notice their progression speeds up on visual field and seems to slow down on OCT,” says Dr. Huang. “That’s really a measurement artifact. You have to be aware of that when you interpret the data. The NFL changes very quickly early on, at about 1 to 3 µm per year, but very slowly in severe glaucoma—a fraction of a micron—for the same level of visual change in decibels per year.
“Interpreting whether this speed of progression is fast or slow can be tricky because the progression speed on these two modalities doesn’t correlate well. It can be difficult to clinically judge progression speed based on structural OCT measurements. Additionally, OCT uses a linear scale (µm) and visual field maps use a logarithmic scale (dB).
“You need to see how fast the disease is progressing to decide whether to intervene or change your treatment, so you need some sort of consistent metric for that in decibels per year,” he explains. “That’s not currently available when we look at structure in microns or perfusion in capillary density. Those numbers are hard to interpret because they depend so much on disease stage.”
Dr. Huang and his colleagues recently developed a way to convert NFL thickness or NFL plexus capillary density into a decibel scale that’s equivalent to visual field mean deviation. He says this partially harmonizes the assessment of the speed of progression.2 The new OCT parameter his team devised, NFL mean deviation (NFL_MD), has better correlation with VF_MD, greater diagnostic sensitivity than average NFL thickness and better reproducibility than VF_MD, he says. He and his colleagues calculated the NFL_MD parameter in the decibel scale from the peripapillary NFL thickness profile nonlinear transformation and visual field area-weighted averaging. However, though NFL_MD agrees well with VF_MD in early glaucoma, it still underestimates damage in moderate to advanced stages.
They tested NFL_MD in Advanced Imaging for Glaucoma study participants (245 normal, 420 pre-perimetric glaucoma and 289 perimetric glaucoma eyes) and found that it had a significantly higher correlation with VF_MD than the overall NFL thickness (p<0.001) and also had significantly higher sensitivity for detecting PPG and PG at the 99-percent specificity level. The NFL_MD was also more reproducible than VF_MD (p<0.001). Differences between the two parameters were -0.34 ±1.71 dB; -0.01 ±2.08 dB; 3.54 ±3.18 dB; and 7.17 ±2.68 dB for pre-perimetric and early, moderate, and severe perimetric glaucoma subgroups, respectively. He and his colleagues plan to continue studying the use of NFL_MD in monitoring glaucoma progression using the same dataset. (The article notes that Dr. Huang and another author, Ou Tan, PhD, have significant financial interest in Optovue, which “may have a commercial interest in the results of this research and technology.”)
Assistive Software
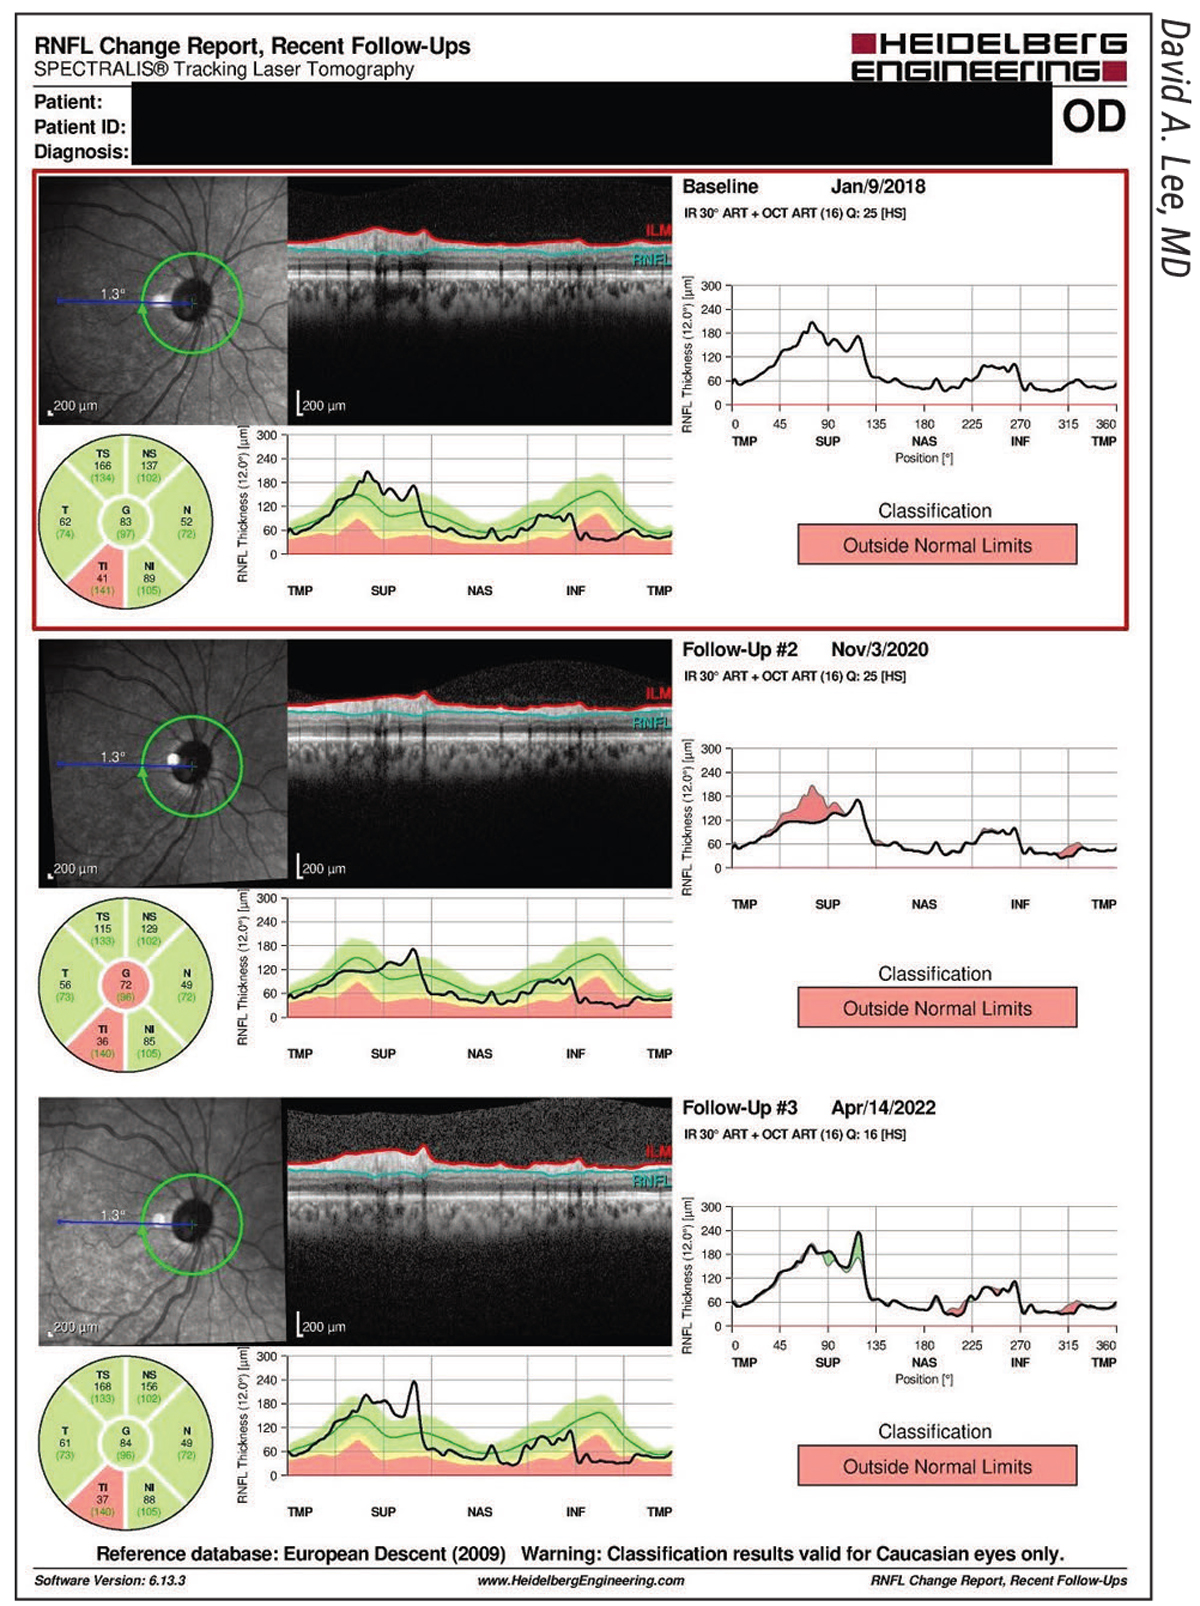 |
| Figure 3. The Spectralis RNFL Change Report of the right eye of the patient from Figure 2. |
Identifying progression in glaucoma is challenging. Fortunately, OCT machines such as the Cirrus HD-OCT (Carl Zeiss Meditec), Spectralis (Heidelberg Engineering), Optovue Avanti (Visionix, formerly Optovue) and Maestro2 (Topcon) all contain software to aid clinicians in detecting disease progression. Experts note that although progression analysis software is helpful, it’s still important to review all of the original scans to ensure nothing was missed.
Most OCTs display a black-and-white image of the optic nerve and another image in a horizontal-linear format showing the pattern of the RNFL thickness, delineated with red and green lines along the inner and external borders of the NFL. “The computer measures the distance between those two lines and compares it with the normal standard for the scanned population so you can see how your individual patient compares with the normal standard,” says Dr. Lee. “This is usually shown in colors of red (abnormal), yellow (borderline) or green (normal). Looking at the nerve texture itself, you can see where the abnormality was detected.”
The Cirrus HD-OCT’s Guided Progression Analysis report performs event- and trend-based RNFL thickness analysis. In its event-based analysis, the GPA assesses changes from baseline compared to expected variability and flags the change as progression if it falls outside of this expected range. Its trend-based analysis examines the rate of change over time using linear regression.3 The GPA software requires a minimum of three tests to determine whether there’s “possible” progression and a minimum of four tests to determine whether there’s “likely” progression. But what about progression between two visits? According to a 2021 study by Donald C. Hood, PhD, and colleagues, comparing topographical changes in different OCT maps and comparing visual fields to OCT probability maps can help.4
The Spectralis uses the Glaucoma Module Premium Edition software. “The Spectralis progression software is based primarily on the values from the RNFL calculation circle and BMO-MRW,” says Dr. John. “For RNFL, there’s both an event- and trend-based analysis, while the BMO-MRW, as part of the GMPE software, provides a trend-based analysis so you can see the rate of change. This can be calculated based on the global BMO-MRW or per sector.”
The Optovue Avanti wide-field OCT includes the Avanti trend analysis software, which tracks RNFL and GCC thickness changes and estimates future progression. Dr. Huang says he conducted his research using this system with Angiovue OCTA software (Visionix) and currently uses the Optovue Solix system from the same company. (Solix isn’t FDA approved.)
Topcon’s fully automated Maestro2 OCT includes the Hood report, an alternative to conventional RNFL thickness graphs in the TSNIT sequence that offers a shifted circumpapillary RNFL and simulated threshold map. (The Spectralis’ Hood report differs slightly in terms of the scanned area of the retina and threshold overlay.) Topcon says its Hood report helps clinicians see which areas of the visual field should be examined for agreement between structural and functional loss.
“Glaucoma progression functions provide you with a global speed of change, whether it’s visual field in decibels per year or thickness in microns per year,” says Dr. Huang. “They’re useful because OCT data is easier for the clinician to interpret when there’s a number to hang your hat on if you can’t compare against literature or compare between patients.”
One thing to note, Dr. Huang continues, is that progression displays don’t tell you where the damage is. “To find the damage, you also need to look at the visual field map, OCT sectors or the profile in terms of the nerve fiber layer or macula,” he adds. “You can actually look at the GCC map, which has even better localizing, to see where the damage is primarily focused. Of course, if it’s closer to fixation—i.e., closer to the fovea—it’s much more alarming. Both macular profile display and trend analysis are important, and you have to look at both.”
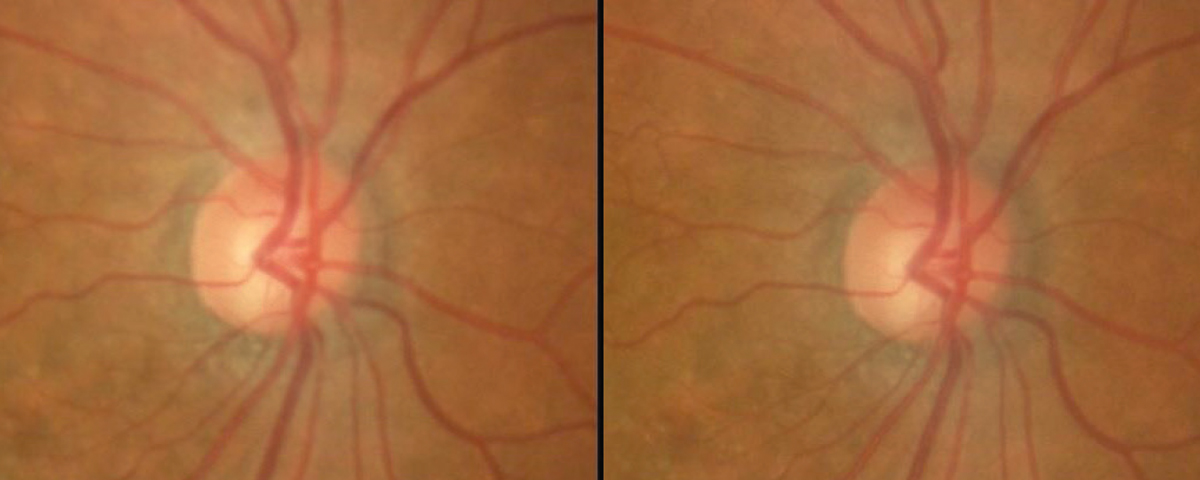 |
| Figure 4. The right-eye optic disc photos of the patient from Figures 2 and 3 show stability over several years. (Photo: David A. Lee, MD.) |
Artifacts
When false positives or false negatives occur, they’re referred to as “red disease” or “green disease,” respectively. This color-coding used by the OCT machine is helpful, but it shouldn’t be the final word in a diagnosis or determination of progression. Many factors—from scan quality to the patient’s relationship to the normal database—may produce erroneous results and lead to misinterpretation of OCT data.
“Red disease may result from low signal strength, high myopia, tilted discs, peripapillary atrophy, media opacities that may block the signal (e.g., PVD) and shifted RNFL peaks,” explains Dr. John. “Green disease may occur in the setting of retinal edema, vitreoretinal traction, myelinated nerve fibers or, if the thinning is focal, it may not be detected in the quadrant and sector scans since the device averages the values.”
“Papilledema may change the appearance of the ONH,” Dr. Lee notes. “Initially, if it’s short term, it may appear as a thicker nerve fiber, but over time the nerve fiber atrophies and grows thinner. You may also see thickening of the nerve due to papillitis. This is often seen in patients with very poorly controlled blood glucose, such as in diabetes. Buried drusen in the ONH may also cause elevation. Having the comparison of progression is very useful to see if drusen are growing over time and causing atrophy of the nerve fiber layers.” He adds that malignant hypertension often causes swelling of the optic nerve, and colobomas may affect how the nerve appears as well.
“Be sure to look at the quality factors of the scan before you interpret whether the OCT shows progression or stability,” Dr. Lee says. “The quality of the image can vary between different technicians. How well a technician focuses the instrument and whether or not the patient was cooperative and fairly stationary during the exam affect image quality.”
OCT machines have their own quantitative parameters to check image quality. Optovue (now Visionix) OCTs have a “signal strength index” (where only scans with a signal strength ≥30 should be considered, per the company’s recommendation); Cirrus’ scan quality index is called “signal strength” (use only scans with a signal strength ≥6, per Zeiss’ recommendation); and the Spectralis has a Q-value. Dr. John notes that on the Spectralis, “The Q-value should be greater than 15. A low-quality value can make the RNFL seem thinner than it really is (red disease).”
Dr. John says other factors that may affect OCT scan accuracy include whether the scan is appropriately segmented and whether the patient falls within the normative database. Additionally, the presence of anatomical variations or artifacts could affect the interpretation of the results.
The magnification effect is another potential confounder since it affects the RNFL thickness measurement, says Dr. Huang. “That may affect diagnosis,” he points out. “Certain parameters may be over- or underestimated if this isn’t corrected for. For example, in a patient with highly myopic eyes, the true scan area could be much larger than the default 3-mm-diameter scan. Nerve fibers spread out and become thinner farther from the disc, so highly myopic eyes may seem to have glaucoma without the pathology because their nerve fibers appear thinner on the scan. This is sometimes called red disease—these patients have red colors on the NFL OCT display, but they don’t really have glaucoma. However, progression analysis for these patients won’t be as affected because the eye’s length doesn’t change much in the typical glaucoma patient’s age range.
“For OCTA, the way we measure flow signal is affected by reflectance signal strength,” Dr. Huang continues. “If your patient has floaters, a small pupil or dry eye, or the focus isn’t adjusted correctly—any reason the signal is decreased could artificially lower vessel density measurements. That tends to be noise because the quality of the scan can change from visit to visit, depending on the operator and patient cooperation.
“You need very high-quality scans for OCTA,” he notes. “This one of OCTA’s limitations. As patients get older, they may develop a cataract or dry eye that reduces the signal. It’s important to compensate for signal strength when measuring vessel density. My group has researched an algorithm that’s unaffected by signal strength. We’ve also developed methods to compensate for it.”
Pearls
Here are some pearls to keep in mind when interpreting OCT data:
• Use the same machine and consider the same parameters. “If you want to compare a patient’s scans over time, be sure to have some stability in terms of the type of OCT machine you use and the parameters you’re looking at,” Dr. Huang says. “You can’t compare scans from different machines when you’re trying to assess change over time. Each machine has a different segmentation algorithm, and their NFL thickness measurements will be systematically biased—some will be slightly thicker and others thinner.”
The same goes for OCTA. “These measurements are relatively new, and different companies have different definitions of vessel density,” Dr. Huang continues. “Some use percent area covered by vessels in certain layers, called slabs, and others use length of blood vessels. So, you have to be careful which quantity you’re looking at. OCTA machines could be significantly different in terms of the area they look at, resolution, quantity, type of area vs. length, threshold for deciding vessel vs. non-vessel, focus, pixel size, etc.”
Additionally, experts say to check for any changes with software updates or machine upgrades from the OCT manufacturer. Though most manufacturers try not to change their measurements between models and perform substantially equivalent comparisons, there may still be small differences. “Technology improves over time, with both hardware and software,” Dr. Lee points out. “It’s good if your OCT manufacturer gives you upgrades. They should let you know how they compare across different time points.”
• Ensure the patient falls within the normative database. “One thing to keep in mind when using your device’s software for analyzing progression is that the normative database may not be representative of every patient you see,” Dr. John says. “Before you interpret the OCT data, be sure to check whether your patient falls within the normative database.”
Additionally, she says the normative database doesn’t include all normal anatomical variations that can lead to misinterpretation of results. “There may be issues with segmentation errors and artifacts,” she notes. “Also be sure that the patient information is entered correctly. The normative database is based on age (and BMO area for the Spectralis’ progression analysis software).”
• Take baseline measurements early. Experts say taking baseline measurements as early as possible is important, especially for those with relatively healthy or normal retinal nerve fiber layers. “In patients with healthier RNFLs, there’s more potential for change than if they were close to end-stage disease, so you need your baseline measurements,” says Dr. Lee.
High myopes aren’t included in the normative database, but Dr. John says there’s still utility in obtaining an OCT in these patients, assuming there are no issues with segmentation that preclude getting a good scan. “You wouldn’t be able to compare the patient to the normative database, but you can use that first scan as their baseline and compare future scans to that baseline,” she says.
• Double check your image quality. “Review all the images and scans provided, including the raw scans to see if there are any issues with segmentation, normal anatomical variations or artifacts that may affect the results,” says Dr. John.
• Review TSNIT profiles for focal loss. “Because the quadrant and sector profiles represent average values, small changes may not be detected if you only look at those scans,” Dr. John says.
• Turn to macular scans in advanced glaucoma. “In advanced glaucoma or if RNFL pathology is present, the macular scans may be useful for monitoring and detecting glaucoma,” Dr. John says. “Once the RNFL reaches the floor effect, macular thickness or ganglion cell thickness measurements can be used to follow these patients.”
• Consider the entire clinical picture. While detecting structural changes over time is important, these findings must correlate with the whole clinical picture for the clinician to fully interpret the results. Dr. Lee says, “I always like to compare the OCT and the visual fields because, for example, if you have a defect in the RNFL that’s on the interior part of the optic nerve, that’ll often correlate with a visual field defect in the superior part of the visual field, such as a paracentral scotoma, an arcuate scotoma or even a nasal step, and vice versa if the RNFL defect is in the upper part of the nerve. Structural changes are usually predictive of functional changes. The Ocular Hypertension Treatment Study showed that changes in the RNFL on OCT often predate the appearance of a corresponding visual field defect. The defect could occur anywhere from one to five years later.
“Additionally, sometimes you may see changes on the OCT early on, but when you check the pressure in the patient, they seem to be very well controlled,” he says. “It’s well known that compliance is sometimes an issue with glaucoma medications. Several studies have shown that patients tend to be a little more compliant right before their office visit when we check their pressure, and sometimes they’ll forget more often when they’ve been away from the doctor’s office for a longer period. Many doctors mistake this for low-tension glaucoma, where, in spite of low or normal pressures in the eye, the patient continues to experience RNFL loss and visual field defect progression.”
• Use OCT to distinguish between glaucoma and non-glaucomatous optic neuropathy. “There may be a discrepancy between the thinning noted on RNFL and macular scans and the optic disc/BMO-MRW scans,” Dr. John says.
• Show the patient their OCT results. Dr. Lee says he finds it helpful to display the OCT exam results on a large computer screen to show his patients. “Most patients find it very interesting to see since they’ve never seen a picture of their optic nerve before,” he says. “Showing an image helps me to explain why we’re doing what we’re doing, regarding pressure lowering, and how we measure it. I find it quite educational for patients.”
This article has no commercial sponsorship.
Dr. Huang receives research support, grants and OCT devices from Optovue. He has patent royalty interest in OCTA technology related to Optovue. Drs. John and Lee have on financial disclosures.
1. Rabiolo A, Mohammadzadeh V, Fatehi N, et al. Comparison of rates of progression of macular OCT measures in glaucoma. Transl Vis Sci Technol 2020;9:7:50.
2. Tan O, Greenfield DS, Francis BA, et al. Estimating visual field mean deviation using optical coherence tomography nerve fiber layer measurements in glaucoma patients. Nature: Scientific Reports 2019;9:18529.
3. Cirrus HD-OCT: How to read the Cirrus reports. Carl Zeiss Meditec. Accessed May 5, 2022. https://www.zeiss.co.uk/content/dam/Meditec/gb/Chris/OCT%20Business%20Builder/PDF’s/1.pdf.
4. Hood DC, Belchior B, Tsamis E, et al. Did the OCT show progression since the last visit? J Glaucoma 2021;30:4:e134-e145.