Without a unified definition of glaucoma and what it means for it to worsen, tracking disease progression is an art form. Here, experts break down key elements of glaucoma monitoring with optical coherence tomography and visual fields, and discuss the potential of virtual reality and remote monitoring devices.
Evaluating Structure and Function
When examining patients for signs of progression, experts look at several OCT parameters, including the optic nerve, peripapillary retinal nerve fiber layer thickness, superior and inferior quadrant thicknesses, and ganglion cell complex thickness. Changes seen on OCT are compared with direct slit lamp biomicroscopy findings or visual fields, and vice versa.
Three main structural tests are used—the circle scan, sectoral scan and macular scan. “Each of these tests has benefits in particular patients, so we use them all,” says Steven L. Mansberger, MD, MPH, the Chenoweth Chair of Ophthalmology and director of the glaucoma service at the Devers Eye Institute in Portland. “The global thickness measurement of the RNFL on the circle scan is a combination of all the quadrants. What constitutes significant change is debatable, but a 10-µm change is usually considered significant. However, if you see a 6-µm change in a patient who’s obviously progressing, there’s no need to wait until they exhibit 10 µm of change to make a decision.
“In research, we also use minimum rim width, which is a sectoral scan of the optic nerve,” he continues. “We’re still trying to understand where this parameter best fits in our evaluation of glaucoma patients. It may be more useful than the circle scan for monitoring patients who have reached the floor. Macular thickness is another parameter we’re studying. We’re trying to understand how it fits into structural analysis, because it’s affected by retinal diseases of the macula. Overall, these structural tests perform better in early glaucoma because many patients reach the floor in later stages of the disease.”
Yvonne Ou, MD, a professor of ophthalmology at the University of California San Francisco School of Medicine, says that when patients reach the floor—demonstrating an average RNFL thickness less than 70 µm (on Optovue RTVue)—OCT may no longer be useful. “The floor effect makes it very difficult to follow patients structurally,” she says. “Visual fields are more useful for later stages of glaucoma. Keep in mind, however, that sometimes patients may have an average RNFL thickness less than 70 µm but there will be a sector or several that aren’t at the floor. These sectors could even potentially be normal when compared to the normative database. You may still be able to follow these patients with OCT only in those specific sectors.
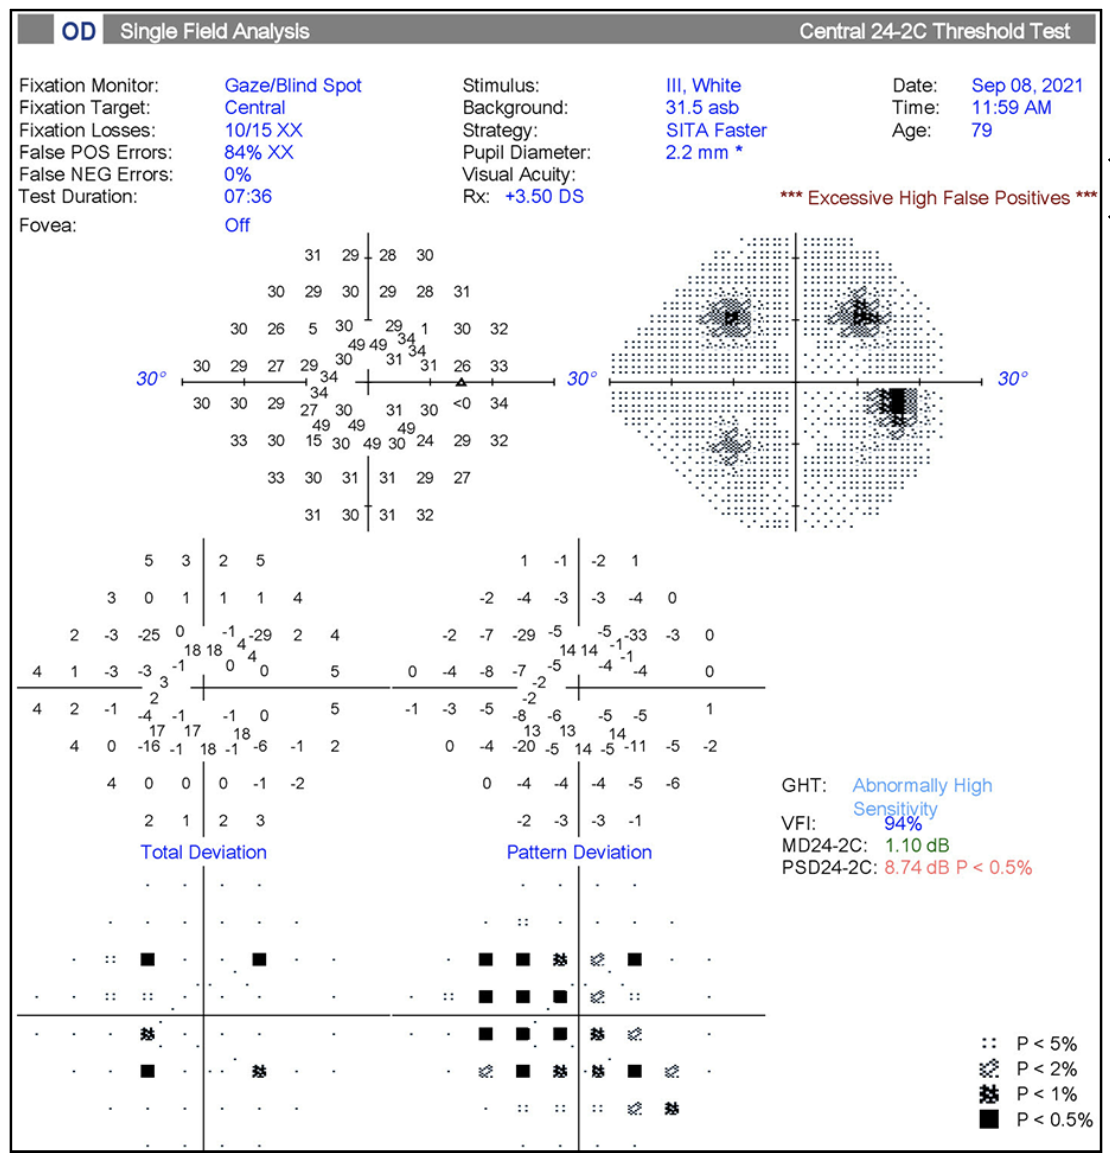 |
| Figure 1. Example of visual field testing artifact. The patient failed to respond to initial stimuli in the four preliminary testing quadrants. After instruction to respond to stimuli, the patient subsequently “over-responded” throughout the remainder of the test as evidenced by a high-false positive rate. Photo: Ahmad Aref, MD, MBA. |
“I typically get visual fields annually for patients with early, mild glaucoma and no visual field changes, and sometimes every other year for a glaucoma suspect I have low suspicion for,” she continues. “Early to moderate glaucoma often warrants visual field testing every six months. For patients with moderate to advanced glaucoma, the OCT may be at the floor and then I rely more on visual field tests, obtaining these tests three or four times per year.”
“When the visual fields become quite severe, with a mean deviation below -19 dB, it’s more useful to switch to a size five stimulus because this raises the frequency of seeing to a level where a patient might be able to detect that area, compared with a size-three stimulus,” Dr. Mansberger notes. “We also recommend switching to a 10-2 visual field when a patient’s visual field threatens their fixation because the 10-2 has many more central presentations.
“Be sure to look at the average mean deviation over a few visits when gauging progression on visual fields,” he adds. “The cutoff for having relatively rapid loss that we think affects quality of life is 1 dB of change per year, with a corresponding 2.5-percent change per year on the visual field index.”
Michael V. Boland, MD, PhD, an associate professor of ophthalmology at Harvard Medical School and the site director of Massachusetts Eye and Ear, Lexington, points out that one of the logistical challenges of monitoring glaucoma is that more frequent visual field testing isn’t often possible. “We need to do more testing to quickly identify people who are worsening,” he says. “It takes multiple tests per year, and one or two isn’t always enough, especially considering the variability in the test. We’re hindered by staffing issues, time and clinic space. One thing my practice is doing to collect more patient data is having certain patients come in more frequently just for visual field testing.”
Studies have reported that vessel density loss, as measured on OCTA, may be a predictive parameter for detecting progression in advanced glaucoma, but for the most part following patients using OCTA remains in the realm of research. “We’re still waiting for OCTA to demonstrate predictive value beyond what we’re getting with just structural measurements,” Dr. Boland says. “It’s an interesting concept but we don’t have clear evidence that any change in blood flow is predictive if it occurs either before or even simultaneously with loss of actual nerve tissue, which we already measure.”
Test-retest Variability
More frequent testing will help mitigate some test-retest variability, which is another challenge every glaucoma specialist faces. “If a patient were to take the same exact test twice during a single visit, there would be some variance between the two tests due to error within the instrument itself or factors such as the test operator and the patient’s attention span or alertness,” says
Ahmad A. Aref, MD, MBA, an associate professor of ophthalmology, medical director and vice chair for Clinical Affairs in the department of ophthalmology and visual sciences at the University of Illinois College of Medicine. “The more frequently we test, the more confident we can be that a given defect may be worsening.”
Many OCT and visual field instruments have manufacturer software that takes test-retest variability into account when analyzing change. If an instrument’s test-retest variability is 7 µm, for instance, any change in thickness measurement greater than 7 µm would be considered significant. Instruments’ error levels may also vary based on the parameter. For example, the Cirrus OCT has a 4- to 5-µm variability of average RNFL thickness but a 7- to 8-µm variability for RNFL quadrants.1
Rely on the Software
When evaluating disease progression, experts say the vendor-provided progression software is your friend. It’s still important to review the original scans for things you may have missed or any artifacts, however.
The Heidelberg Spectralis’ Glaucoma Module Premium Edition software bases its analysis primarily on values from the RNFL calculation circle and BMO-MRW. Topcon’s Maestro2 OCT uses the Hood Report, which displays a shifted circumpapillary RNFL and simulated threshold map.
Dr. Aref explains that Zeiss’ Guided Progression Analysis compares a current test, whether it’s OCT or visual field, to the most recent test(s) or to the baseline test of a patient. The GPA incorporates what would be expected for each testing location, in terms of normal variance, and anything outside of this triggers an alert for possible disease worsening. Zeiss’ progression software requires at least three tests to determine “possible” progression and at least four tests to determine “likely” progression.
“If a given parameter has worsened beyond what one would expect from test-retest variability, and if that worsening occurred over two consecutive tests, I’d say that that’s progression, excluding any other possible non-glaucomatous reasons for worsening,” he says.
“I rely heavily on the vendor-provided software and Guided Progression Analysis for the visual fields,” says Dr. Boland. “I also use a combined report as backup, a structure-function analysis provided for the Cirrus and the Humphrey Field Analyzer, which provides a change analysis for both the visual field and optic nerve together on the same screen. This is useful for trying to correlate changes in the visual field with changes in the optic nerve. Zeiss’ tools also let you interact with the tests, removing ones you don’t like, so you can restart your analysis.”
Dr. Ou says that the RTVue’s trend analysis software tracks RNFL and GCC thickness; it plots out six tests on a single printout: two baseline tests and four follow-up tests. “As a user, you can select what the baseline tests are,” she says. “For patients who have been followed for a decade or longer, their baseline test may not be relevant. Let’s say they had demonstrated progression and then we did glaucoma surgery. I’d reset their baseline by selecting two tests that followed the intervention. You can also do this with visual fields. On the Zeiss Forum software, you can set the baseline tests and annotate when interventions occurred.”
Interpretation Impediments
There are many artifacts that can complicate accurate interpretation of OCT and visual fields, from segmentation errors to poor patient cooperation. “If a study is affected by an artifact (Figure 1), you shouldn’t hesitate to repeat it,” says Dr. Aref. “The tests can be repeated as often as you need to get a good, accurate study for progression analysis.”
Here are some other factors that may affect scan quality and test outcomes:
• Media opacities, dry eye and corneal disease. Any of these can prevent light from focusing properly, resulting in a poor-quality OCT scan. Additionally, dry-eye patients may require artificial tears before taking the visual field test.
• Ptosis. Droopy lids, more often seen among older patients, can give the appearance of a visual defect since the patient isn’t able to see the obscured stimuli.
• Cataract. Cataract can affect both OCT and visual fields by obstructing light. “In the case of visual fields, the patient’s not seeing the stimuli—not because of glaucoma but because of the cataract,” Dr. Aref says.
• Fatigue. Fatigue artifact is common for visual field testing. “Visual fields depend on a patient’s active response,” notes Dr. Aref. “Many of our patients are older and fatigue may limit their ability to respond to stimuli, even if stimuli are seen.”
• Abnormal optic nerve. An abnormal optic nerve isn’t necessarily glaucoma; it’s just different from the normative database. “Myopic patients’ optic nerves are often shaped slightly differently—somewhat tilted or elongated,” he continues. “Because the OCT compares the test with non-myopic (normative) individuals, it may suggest this abnormality is glaucoma. Myopia isn’t an artifact but a true defect though. The key is when these are related to myopia, they almost always don’t progress.”
• Age-related thinning. “In a mild myope, you might not expect there to be any change year after year, so if you observe some RNFL thinning, consider that age is a risk factor for thinning,” Dr. Ou says. “There’s probably some age-related decline happening, especially in older patients.”
• Schisis. “Schisis, or separation of the retinal layers, is commonly missed,” Dr. Mansberger says. “It can be subtle, and it may come and go (Figure 2). Some instruments don’t allow you to actually inspect the scan. They’ll sometimes have smoothing algorithms that make it difficult to detect schisis.”
 |
| Figure 2. Schisis is a commonly missed source of artifacts on OCT. It often comes (middle) and goes (bottom), and devices’ smoothing algorithms may obscure it. Photo: Steven L. Mansberger, MD, MPH |
• Peripapillary atrophy. “Peripapillary atrophy occurs around the optic nerve, and you’ll see areas where the retinal pigment epithelium is thinned or missing,” he continues. “This will create an artifact. Sometimes people may not realize the scan is going through an area of peripapillary atrophy, and that’s why the scan looks so abnormal.”
• Fixation errors. Fixation errors are quite common and occur when the device isn’t centering the image in the same location over time. “It’ll seem like the tissue has become thin in a certain area, and that’s because the image hasn’t been centered appropriately,” Dr. Mansberger says.
The Peri-verse
The standard visual field test is key for diagnosing and monitoring glaucoma, but it’s subjective, takes several minutes to administer and requires patients to stare into the machine for long periods. Experts say that virtual reality perimetry may ameliorate some of these issues. These devices gained additional attention during the pandemic, when the need for portable, remote monitoring tools became more apparent than ever.
“I’m very excited about virtual reality for detecting visual field loss,” Dr. Mansberger says. “These devices are portable, you don’t need a special room to do them in, and they can use the same technologies that are available on more expensive visual field machines. They’re ideal for patients who have mobility issues and issues getting into position at a regular machine.”
There are still several hurdles that these devices must contend with before they can enjoy widespread clinical adoption, however. “So far, most of these devices don’t have great cross-sectional normative data, so we don’t know what’s normal and what’s abnormal,” Dr. Boland notes. “Then, if they do have that data, many don’t yet have substantial longitudinal normative data, so we can’t tell if someone’s getting worse or not. That’s key from a clinical perspective. The concept of making the test easier to do, and in different settings, is very promising, but there’s still a lot of work that needs to be done before they’re ready for the clinic.”
“Another of the downsides is that there are so many different algorithms and different devices being used,” Dr. Mansberger says. “You can’t take the results from one and track progression if the patient suddenly switches to a different device. It can also be challenging to integrate these devices into your EHR.”
There are several head-mounted virtual reality devices in development, including:
• VisuALL (Olleyes). The VisuALL perimeter has been studied at Wills Eye Hospital and the University of Alabama at Birmingham. Researchers reported “excellent” global mean deviation test-retest reliability and 100-percent adherence among 76 percent of patients (n=17) in a small study on compliance and the device’s repeatability at home.2 When compared with the Humphrey Field Analyzer (n=102 eyes), the VisuALL had significant correlation of global mean sensitivity (p=0.001) and high diagnostic performance in normal and glaucoma patients.3
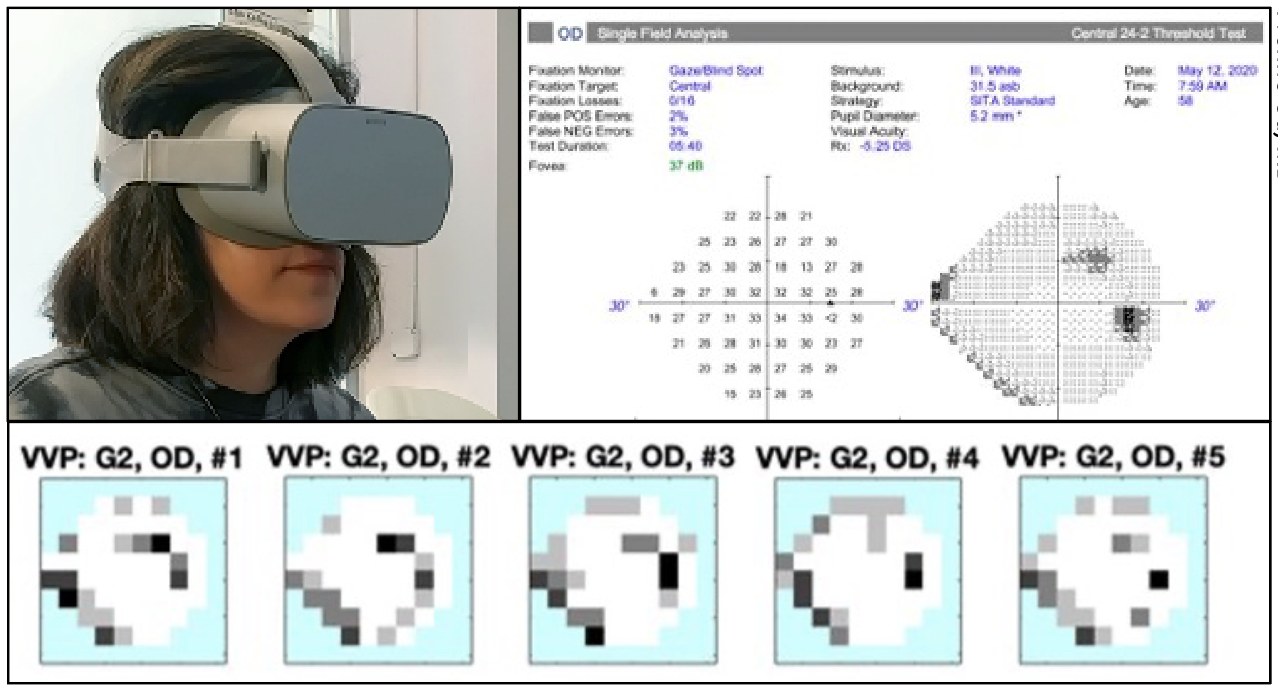 |
| Figure 3. Patient wearing virtual reality headset (top left). A different patient’s visual field tests using Vivid Vision Perimetry (bottom) and standard automated perimetry (top right). Photo: Yvonne Ou, MD. |
• Vivid Vision Perimeter (Vivid Vision). Dr. Ou has been testing and validating the Vivid Vision Perimeter (Figure 3). “The power of all these virtual reality visual field devices is in their portability and relatively low cost,” she says. “Patients can gather much more data, and we can do more testing to overcome issues of variability. We’ve sent patients home with headsets and have trained them over Zoom. While we conducted our study, we were limited in some ways by the pandemic, but we were able to demonstrate the feasibility of remote training for patient self-administered tests.
“We had patients take the test 10 times over a 14-day period,” she continues. “We found that patient acceptability of taking the test as well as the test-retest variability were quite good. This particular test is unique among some of the other virtual reality visual field tests because it uses a different testing strategy that doesn’t require patients to suppress their foveation reflex, as is the case with standard automated perimetry. In this test, patients look at the stimulus by moving their head toward it. They can also use a remote-controlled pointer. This approach is easier and more intuitive for many patients because they don’t have to suppress their desire to look at the stimuli.
“We have tests that are both fixed contrast and mixed contrast,” she says. “We have multiple centers testing this perimeter, including New York University. We need to demonstrate that the device can detect patient stability and visual field progression. These studies will take time, but they’re underway.”
• VF3 (Virtual Field). Visual field testing using Virtual Field’s VF3 perimeter (BOLT strategy) was reportedly similar to HFA SITA-Standard 24-2, according to a retrospective study conducted during the pandemic by Stony Brook University’s Department of Ophthalmology.4 A total of 76 patients underwent virtual visual field testing, 48 of which had had HFA performed in the past year. The researchers reported that virtual testing demonstrated no difference in ratio of fixation losses (mean difference -0.08, p=0.45) or number of false negatives (mean difference 2.07 percent; p=0.05). Additionally, they found no significant difference in mean deviation between the two devices (mean difference 4.11; p=0.45). Compared with HFA, VF3 had a lower pattern deviation and visual field index (mean differences -0.23 and -2.87, respectively; both p=0.05). The virtual reality testing took an average of 2.4 minutes less time than the HFA.
• VirtualEye (BioFormatix). VirtualEye performs the equivalent of a full-threshold 24-2 visual field. Researchers reported in a 2014 proof-of-concept study that the device reliably detected large visual field defects and was in agreement with HFA measurements.5 When compared with the HFA (VirtualEye group n=84; HFA group n=79), patients’ average test time was 10.6 ±3.3 minutes and 9.4 ±2.1 minutes for the manual- and visual-grasp VirtualEye tests, compared with 6.1 ±1 minute for SITA Standard tests.
• VF2000 (Micro Medical Devices). A cross-sectional analysis of 97 patients using the VF2000’s diagnostic performance reported 100-percent sensitivity and specificity for the classification of patients as glaucoma or non-glaucoma, but a high proportion of misclassification of glaucoma severity.6 Around 28 percent of moderate cases were misclassified as mild and 17 percent were misclassified as severe; 20 percent of severe cases were misclassified as moderate. The general agreement between the VF2000 and HFA was 0.63 overall, 0.76 for mild glaucoma, 0.37 for moderate glaucoma and 0.7 for severe glaucoma.
• AVA Advanced Vision Analyzer (Elisar Vision Technology). Researchers conducted a prospective, cross-sectional study of 160 eyes (85 controls; 75 glaucoma patients) for functional assessment; 15 eyes for test-retest variability; and 107 eyes for blind-spot trial (45 normal; 62 glaucoma eyes).7 All study participants underwent both the AVA Elisar Standard Algorithm (ESA) and SITA Standard 24-2 testing. The AVA test took slightly longer than HFA, at 7.08 ±1.55 minutes versus 6.26 ±0.54 minutes (p=0.228). The sectoral mean sensitivity difference was -2.2 ±2.3 dB in controls (p<0.001) and -2.6 ±3.5 dB in glaucoma patients (p<0.001). For test-retest variability, the researchers found that response variability decreased with an increase in sensitivity and eccentricity. They reported accurate blind spot location, good correlation of testing methods’ global indices and concluded that AVA demonstrated “substantial equivalence” to HFA SITA-Standard and may accurately assess visual fields.
Dr. Ou says that virtual reality visual fields will need rigorous study, but they’re poised to become useful adjuncts in the clinic. “Once it’s been demonstrated that we can reliably detect stability and progression, these devices will fit nicely into the treatment algorithm. They may also be useful in patients who’ve had a major intervention such as glaucoma surgery since they’ll enable the collection of more new baseline data.”
Monitoring IOP Around the Clock
An incomplete picture of a patient’s eye pressures can complicate treatment decisions. “We’ve begun having patients check their pressures at home,” says Dr. Boland. “We may think a patient is getting worse based on testing in the clinic, but their pressures seem fine. We’re now finding folks who have intraocular pressures that do strange things outside of clinic hours, so home-monitoring has been very useful.”
Studies have reported that diurnal IOP and IOP fluctuations can be significantly higher than pressures measured in the office. In a study of 100 patients, 66 percent had peak IOP measurements outside of their clinic visit, with mean diurnal IOP fluctuations of 7.03 ±2.69 mmHg compared with 4.31 ±2.6 mmHg in the office (p<0.003).8
The iCare Home has been demonstrated to reliably detect therapy-related IOP changes in glaucoma and ocular hypertension patients, with strong correlation with in-office Goldmann applanation tonometry.9 Remote training has also shown similar success rates to face-to-face teaching on the same device.10
Dr. Boland uses a Utah-based service called MyEyes.net that sets up patients with home pressure monitors. Patients can rent an iCare Home2 tonometer for $250 per week or purchase one for $2,995. MyEyes coordinates all device delivery and return, removing a substantial burden from clinics who want to offer home pressure monitoring.
Counting Cells
Here are two new ways of counting retinal cells that may one day aid earlier detection of glaucomatous damage:
• Quantifying cell apoptosis. Retinal ganglion cell loss is an indication of glaucomatous damage, but a good amount of damage must occur before it’s picked up on OCT or visual fields. Now, there’s a new technique for detecting early ganglion cell loss called DARC—Detecting Apoptosing Retinal Cells—which was developed by Professor Francesca M. Cordeiro, a professor and chair of ophthalmology at Imperial College London.
How does DARC work? Early-stage apoptosing retinal cells externalize phosphatidylserine, a cell membrane phospholipid, for which the protein annexin A5 has a high affinity. Fluorescently labeled annexin attaches to the externalized phosphatidylserine, and this makes the apoptosing cells visible on confocal scanning laser ophthalmoscopy. Professor Cordeiro’s group developed an accurate and reproducible artificial intelligence system to count these cells in vivo.
A study using a convolutional neural network (97-percent accuracy, 91.1-percent sensitivity, 97.1-percent specificity) to count cells in 40 controls and 20 glaucoma patients reported significantly greater numbers of apoptosing retinal ganglion cells in patients who later progressed on OCT (p=0.0044).11 DARC is also being investigated in geographic atrophy and AMD. An intranasal annexin administration route is in development, which researchers say may broaden the technology’s adoption (compared with the well-tolerated intravenous route).12 The Phase II clinical trials were completed last year.
• Adaptive optics. Pairing OCT with adaptive optics—a technique that improves an optical system’s ability to pick up fine details by reducing incoming wavefront distortions—may offer another means of counting retinal cells in vivo. As with DARC, an artificial intelligence algorithm is in development to take on the burden of counting cells. In a study using a deep learning algorithm to segment and measure ganglion cell layer somas with adaptive-optics OCT images, researchers reported that glaucoma patients’ soma diameters were greater versus controls and that there was a strong linear correlation between local ganglion cell layer density and measured thickness. They also reported an increase in glaucoma patients’ structure-function correlation when using the AI system compared with OCT thickness measurements.13
Pearls for Success
Monitoring glaucoma and identifying progression is challenging. Here are some tips to keep in mind:
• Progression displays don’t show you where the damage occurs. Analysis software uses global parameters such as average RNFL thickness and average mean deviation. “You shouldn’t overly rely on these metrics or parameters because there may be localized changes,” Dr. Ou says. “Let’s say there’s localized RNFL thinning or localized deepening of a scotoma. Those will be missed if you rely only on global metrics.”
• Be on the lookout for optic nerve hemorrhage. “As much as we rely on OCT, an optic nerve hemorrhage won’t be detected by the instrument,” Dr. Aref says. “Optic nerve hemorrhage is a marker for progression, and if found, it can have significant implications for how a patient is treated. Remember to examine the optic nerve and specifically look for hemorrhage.”
• Don’t be afraid to repeat tests. “If you suspect a patient’s getting worse, the best thing you can do before advancing therapy, unless it’s obvious they’re getting worse, is to repeat the test within a short period,” Dr. Mansberger says.
Dr. Ou agrees: “Always recheck the visual fields to confirm the change you see before advancing treatment, especially surgeries such as trabeculectomy or tube shunts.”
• Trust the analysis software. “You can rely on these sophisticated software packages,” Dr. Aref says. “They’re more useful than reviewing individual tests on your own and coming up with criteria for progression. We just don’t have the ability to take into account everything that an algorithm does, especially in a high-volume clinic.”
• Know your device’s floor. The floor differs among OCT instruments since each platform has its own algorithms for calculating RNFL thickness. “Be sure to know your device’s floor as well as your system’s expected age-related decline, which can be found in the literature,” Dr. Ou says.
Drs. Ou, Aref and Mansberger have no related financial disclosures. Dr. Boland is a consultant for Zeiss, Topcon, Janssen Pharmaceuticals and Allergan.
1. Budenz DL. OCT progression analyses. AAO Subspecialty Day 2022.
2. Razeghinejad R, Abu SL, Katz LJ, Myers JS, Racette L. Repeatability of home-based visual field testing using a virtual reality perimeter. Virtual Poster Presentation, American Glaucoma Society Meeting 2022 in Nashville, TN.
3. Razeghinejad R, Gonzalez-Garcia A, Myers JS, Katz LJ. Preliminary report on a novel virtual reality perimeter compared with standard automated perimetry. J Glaucoma 2021;30:17-23.
4. Nanti NB and Lenoci J. Comparison of virtual reality visual field testing to Humphrey visual field testing in an academic ophthalmology practice. Invest Ophthalmol Vis Sci 2021;62:8:3486. 2021 ARVO Meeting Abstract.
5. Wroblewski D, Francis BA, Sadun A, et al. Testing of visual field with virtual reality goggles in manual and visual grasp modes. Biomed Res Int 2014;2014;206082.
6. Shetty V, Sankhe P, Haldipurkar SS, et al. Diagnostic performance of the PalmScan VF2000 virtual reality visual field analyzer for identification and classification of glaucoma. J Ophthalmic Vis Res 2022;17:1:33-41.
7. Narang P, Agarwal A, Srinivasan M and Agarwal A. Advanced Vision Analyzer-Virtual Reality Perimeter: Device validation, functional correlation and comparison with Humphrey Field Analzyer. Ophthalmol Sci 2021;1:2:100035. Poster Presentation, 2018 American Academy of Ophthalmology Meeting in Chicago.
8. Arora T, Bali SJ, Arora V, et al. Diurnal versus office-hour intraocular pressure fluctuations in primary adult onset glaucoma. J Optom 2015;8:4:239-243.
9. Scott AT, Kanaster K, Kaizer AM, et al. The utility of iCare HOME tonometry for detection of therapy-related intraocular pressure changes in glaucoma and ocular hypertension. Ophthalmol Glaucoma 2022;5:1:85-93.
10. Barbour-Hastie CC and Tatham AJ. Teaching home tonometry using a remote video link. Eye (Lond.) 2022;1-5.
11. Normando EM, Yap TE, Maddison J, et al. A CNN-aided method to predict glaucoma progression using DARC (Detection of Apoptosing Retinal Cells). Expert Rev Mol Diagn 2020;7:737-748.
12. Cordeiro MF, Hill D, Patel R, eta l. Detecting retinal cell stress and apoptosis with DARC: Progression from lab to clinic. Prog Retin Eye Res 2022;86:100976.
13. Soltanian-Zadeh S, Kurokawa K, Liu Z, et al. Weakly supervised individual ganglion cell segmentation from adaptive optics OCT images for glaucomatous damage assessment. Optica 2021;8:5:642-651.


