In our practice, we've developed a system for capturing and organizing all this information that has streamlined the review process to a remarkable degree. A combination of well-organized forms, color-coding of charts and information, visual presentation of key data over time and protocols for laying out patient data in the exam room have made it possible for me to know everything I need to know about a patient's current and previous status within a minute or two.
Here, I'd like to share some of the strategies we've used to accomplish this.
A "new patient form" specific to glaucoma is filled out as soon as it becomes clear that glaucoma is, or may be, an issue for a given patient. Like other key forms, it"s color-coded for easy locating in the folder.
Gathering New Patient Information
Of the forms we use to gather information, two are key. The first assembles all the initial data as soon as we decide that a patient requires glaucoma care. The second follows his or her changing information over the course of multiple office visits.
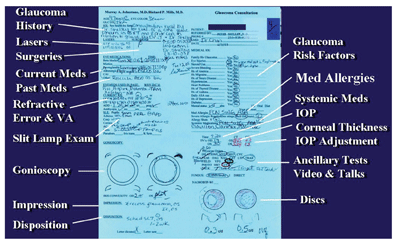
Probably the most important thing about the "new patient" form is simply that every glaucoma suspect or patient gets one. In many offices, the initial assessment of glaucoma is not flagged or identified in any special way. But because these patients need specific kinds of attention, we have the patient work with a technician to fill out a color-coded glaucoma form as soon as a glaucoma-related diagnosis is made. [See image.]
The standardized form is helpful because it puts all the relevant information in specific locations, making it easy to find pertinent data without searching for it. This is especially useful with a new, incoming glaucoma patient—as opposed to an existing patient who shows signs of developing glaucoma—because all the information you need for assessment is clearly laid out for you before you see the patient for the first time.
We get the information from the patient in a two-stage process. First, the patient fills out a form that asks about relevant medical issues, including medications; then a tech transfers that information onto our standardized sheet, filling in missing information by interviewing the patient.
Monitoring Change Over Time
The second key form is our flowsheet, which is designed to quickly portray stability or progression over the course of multiple visits. [See sample.] It includes information about intraocular pressure, medications tried in the past, those currently in use, ancillary tests that have been done or need to be done, the doctor's assessment and the patient's disposition. The sheet itself is color-coded, and some of the information written on the sheet also uses color-coding to speed recognition. Shorthand abbreviations allow a lot of information to be included in a small space.
The central area of each sheet is divided into six vertical columns, with different rows for different types of information. The six columns allow information from six consecutive visits to be placed side by side for easy comparison. Some of the current visit's information is gathered before the exam by the technician; most of the rest is noted by a scribe during the exam. Here's how each section works:
• Abbreviation key. At the top of the sheet, there's an abbreviation key, explaining the shorthand we use further down the page to summarize the patient's condition (AC=adequate control, BC=borderline control, etc.), and to note patient reactions to medications (A=allergy, NB=no benefit, T=toxicity, etc.) You're not required to embed the abbreviation key in the chart as long as you list your abbreviations in your policy manual, but having them on the chart can be helpful.
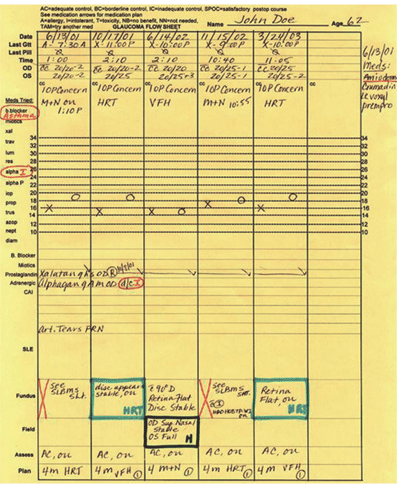
The flowsheet summarizes key past data, graphically displays introcular pressure over recent visits, and makes it easy to see the impact of different treatment factors on IOP. Columns tie together the compliance data, visual acuity, IOP, meds in use, tests done, assessment and plan at each exam. Information about previous meds and patient response is noted on the left, using abbreviations defined at the top of the page. (This information is carried forward whenever a new sheet is added for additional visits.)
• Last meds taken and visual acuity. At the top of each of the six columns we note the exam date and time, and when the patient took his most recent drops and pills. This helps us know whether the patient is compliant or not, and reminds the patient that compliance is important. Below that, the technician writes in the Snellen acuity for each eye, and there's a space for the doctor to make comments about the patient's status.
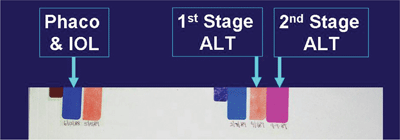
• IOP over time. One of the most useful aspects of the flowsheet is that it allows us to display the patient's IOPs over time, graphically. This creates a chart that clearly shows the patient's IOP trends and current medication situation—far more helpful than leafing through a chart trying to pick up pressures and correlate the related medication information in your head. In addition, you can schedule office visits at different times of day to reveal information about diurnal swings in IOP. [See examples.]
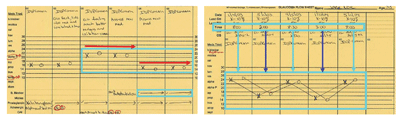
Having IOP displayed graphically over time makes it possible to see the effect of the added medications documented underneath (above, left) or to see how the patient"s presure changes at different times of day (above, right).
• Medications and their effect over time. Two types of information are important in terms of tracking medication use: 1) Which meds has the patient tried in the past and what effect did they have? and 2) What is the patient currently using and what effect is it having? Our flowsheet gives us this information at a glance.
To the left of the IOP graphing section we have a vertical list of "Meds tried." We circle each medication that has been tried in the past and use the abbreviations (summarized at the top of the sheet) to note what the patient's response to the medication was. When a sheet is filled after six visits and we start a second flowsheet, this information is transferred, so the current sheet always shows the patient's complete history of med use.
At the same time, the chart includes rows underneath the IOP graphing area that allow us to chart current medications in use or started at any of the six visits. Because these are aligned by visit, it's easy to see the IOP response to the medication in the IOP graph above. (When the patient stays on a med for a long time, you can quickly look back at previous flow sheets and see how the IOP has responded over the long term.) We also note any new information about reactions to the medication, such as an allergic response, in these rows.
• Ancillary testing. The rows at the bottom of the flowsheet are used to show which ancillary tests have been done, with comments about their results. We outline the block in colors to draw attention to the information and identify the type of test instantly. For example, a red X means a dilated exam; green means an imaging scan. (We also write in the type of scan, such as HRT, OCT or GDx.) This protocol makes it easy to quickly identify the date when a specific test was last done, and thus know which tests need to be done next.
Finally, in the last two rows we note our assessment and the tests that need to be done at the next visit. The assessments, noted using abbreviations, are included primarily for insurers such as Medicare.
Color Coding
Having all of this information organized this way on our forms is extremely helpful, but it's also important to be able to locate a given form in the chart quickly. For that reason, key forms are printed on distinctively colored papers. In addition, we attach matching color-coded tabs to the most important sheets (initial exam, flowsheet, gonioscopy findings, optic nerve findings, and our post-surgery infection risk sheet) so we can pull the desired form from the chart without having to thumb through the chart's entire contents.
Colored stickers at the edge of the folder make it possible to see all previous surgery information for each eye at a glance.
We also place color-coded markers (stickers serving as tabs) at the edge of the outside of the chart jacket to instantly convey the history of the patient's previous surgical procedures. [See example.] These tell me everything the patient has undergone in terms of surgical management before I even open the chart. Short tabs (red or dark blue) identify whether the markers next to them refer to the right or left eye. (The two groups of markers are separated by space to avoid confusion.) Longer markers next to the short ones identify the procedures each eye has undergone; different colors indicate different categories of procedure (white tabs—glaucoma surgeries; blue—cataract; red—cornea; green—retina). Within those categories, different shades of the color and hand-written notes on each tab provide further details.
Exam Room Protocol
In addition to the information contained in the sheets and provided by the tabs on the outside of the chart jacket, most glaucoma patients' folders also accumulate visual fields, photographs and scans. When a number of these are in a chart, our technicians are instructed to arrange them on the exam room counter in a standard pattern, making it easy to scan them quickly as soon as the doctor enters the room. There's no need for us to fumble through the chart trying to find the material we need.
Before I arrive, the tech lays out the visual fields in two piles, with the left eye on the left and the most recent fields on top and preceding ones underneath, in order. [See example.] Because the layout is always the same, it's easy to quickly review the fields. Our techs also lay out the relevant photos on the light board, as well as the scans. (However, now that we have three imaging instruments, this is a more complex problem; we're still deciding how we want to lay out this accumulated information.)
Faster, Better-Informed Decisions
This system of organizing and displaying glaucoma patient information allows a very rapid synthesis of all of the patient's information. It lets us see more patients, and yet do so in a way that allows us to make better-informed, more focused decisions.
When I arrive at the exam room, I already know which surgeries the patient has had, thanks to the tabs on the chart. The flowsheet is easily accessed; the pressure profile over time is graphically displayed, tied to time of day and current medications; all information about prior and current meds is plainly visible. The fields are laid out waiting for me, and any significant field loss is easy to spot. I review the flowsheet briefly and flip through the disc photos. In most cases, I can quickly review everything and have a good sense what the patient's current target pressures ought to be.
(Note: I believe that dynamic target pressure assessment is preferable to referring to a target pressure established many months or years previously. Using a highly organized chart permits a rapid, informed assessment of the target pressure range at each visit, taking into account issues of pressure responses to medications, the risks of the next escalation of therapy and the patient's current health.)
The one limitation of a system like this might be practice size. I have my own private practice, and I constantly work with the staff to make sure the system is optimized and being used correctly. In a large clinic, you'd have to rely on a strong administrator who could make sure a system like this was implemented successfully and used consistently. If anyone in the practice failed to follow the protocol, the advantages could be quickly lost.
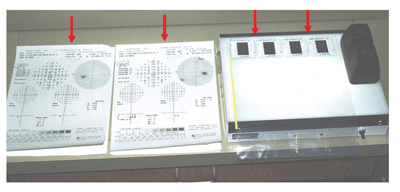
Having visual fields, photographs and other records laid out in a standard pattern before the doctor arrives makes it easy to scan the information and spot changes in patient status quickly.
Despite that one caveat, it's a great system, and it's removed a lot of the pain that comes with managing ever-increasing mountains of glaucoma patient data. If you manage glaucoma patients, I urge you to try it.
Dr. Johnstone is in private practice in Seattle, and is a glaucoma consultant at Seattle's Swedish Medical Center.