Autofluorescence is a natural phenomenon by which a fluorophore is excited by a certain wavelength of light, causing it to re-emit this light at a longer wavelength. It’s also a powerful tool for monitoring endogenous fluorophores and biological conditions.1 Fundus autofluorescence is an in vivo imaging tool that enables non-invasive metabolic mapping of natural and pathological fluorophores in the posterior pole, mainly the retina and retinal pigment epithelium.
In this review, we highlight some recent developments in FAF imaging that have enhanced our understanding of retinal diseases and have promising prospects for monitoring disease progression, following patients in clinical trials and potentially influencing treatment outcomes.
Autofluorescence Explained
There’s a relationship between the morphofunctional properties of the fluorophores and their emission feature.1 Each fluorophore has a particular AF signature. There’s probably a continuum of the spectral fundus autofluorescence from blue to near-infrared (NIR) because of the combination of the different fluorophores (for example melanolipofuscin granules of different orders). FAF must be interpreted depending on the wavelength used, as different wavelengths will excite different fluorophores.2 The fluorescent spectrum can therefore allow for topographical mapping of the endogenous fluorophores like lipofuscin, melanin or melanolipofuscin at the level of (post mitotic) retinal pigment epithelium/photoreceptor (outer segment) complex.3,4
Schepens Eye Research Institute’s Francis Charles Delori, PhD, and his colleagues5 first noticed in vivo FAF during vitreous fluorophotometry. Several types of light sources can be used to stimulate the fundus to exihibit autofluorescence. Flood illumination projects a single flashlight to the entire retina, but pre-retinal structures can impede the AF signals. A study by New York retinal specialist Richard Spaide suggested shifting the emission and excitation wavelengths to the red end of the spectrum to resolve the impeding signals from pre-retinal structures.6 Other teams proposed the use of filters of longer wavelengths (excitation filter: 535 to 580 nm; barrier filter: 615 to 715 nm). These operate with excitation in the green spectrum and emission in the yellow-orange spectrum and are also called green-AF.4 The most used and most efficient type of light source is therefore a laser (with a fixed unique wavelength) through the use of confocal scanning laser ophthalmoscopy, which helps overcome AF signals from preretinal structures like the lens, and has the best signal-to-noise ratio and retinal safety.7 To date, the commercially available cSLOs allow for exploration of FAF at 488 nm (blue) and 787 nm (NIR). The RPE/retina complex is known to be autofluorescent both with blue excitation and at near-infrared autofluorescence, and have a different pattern, due to the selective excitation of different fluorophores by each wavelength.
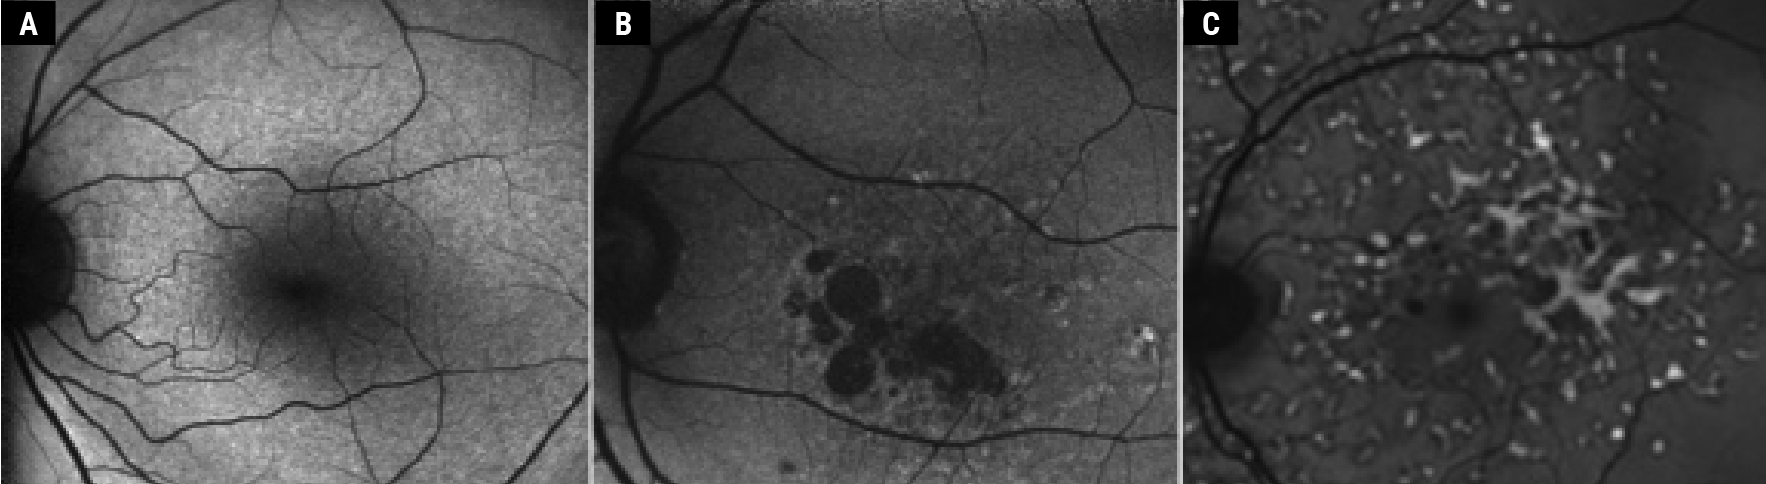 |
| Figure 1. Blue Autofluorescence. Normal autofluorescence (A), dry AMD (B) (adapted from Ly et al13) and Stargardt’s disease (C) (adapted from Jeffery et al14). Copyright license for Fig. 1, B and C: http://creativecommons.org/licenses/by-nc/4.0/. Images have not been modified from original publication. |
Blue Autofluorescence
Low-powered laser beams are used in cSLO, with excitation filters (488 nm) and emission filters (500 to 580 nm) which are used to detect AF signals and are also called short wavelength (SW) AF or blue AF. Blue AF was the first clinically used AF as a diagnosis tool, after the use of the blue excitation light for fluorescein angiography.7
The blue AF comes from the outer segment of the photoreceptors and the RPE due to the formation and accumulation of lipofuscin.8 An irreversible non-enzymatic reaction of retinaldehyde with lipid (phosphatidylethanolamine) in photoreceptor outer segments, results in formation of lipofuscin/bisretinoid fluorophores, which can be excited by blue light, emitting a green light.5,9,10 The bisretinoids of lipofuscin are a family of 20 compounds, of which A2E is the best-known fluorophore. These accumulate in the lysosomal storage bodies from photo-oxidative alterations, and its conjugate double bonds promote light absorption and fluorescence emission.11 The emission spectra of the fundus shift slightly to shorter wavelengths in healthy subjects and even more in patients with age-related macular degeneration,12 likely reflecting the accumulation of lipofuscin in the RPE/retina with aging and in AMD.
High concentration of xanthophylls (lutein and zeaxanthin) and melanin result in hypoAF of the foveal region because of a masking effect. Lack of RPE in the optic disc and blocking of AF by the blood contents in the retinal vessels result in the dark appearance of both optic disc and vessels on AF (Fig. 1A). Less evident blockage by macular pigments and less signal reduction over the optic disc and retinal vessels are noted on green-AF (fundus camera).4 HypoAF signal is noted in conditions with reduced RPE cell number, masking or lower concentration of lipofuscin. RPE atrophy (such as in atrophic AMD, Figure 1B), fibrosis, presence of intraretinal fluid, pigment or blood accumulation are all causes for hypoAF. HyperAF signals are often noted in conditions with increased lipofuscin (such as Stargardt’s disease [see Figure 1C], Best’s and other types of dystrophies).1,2
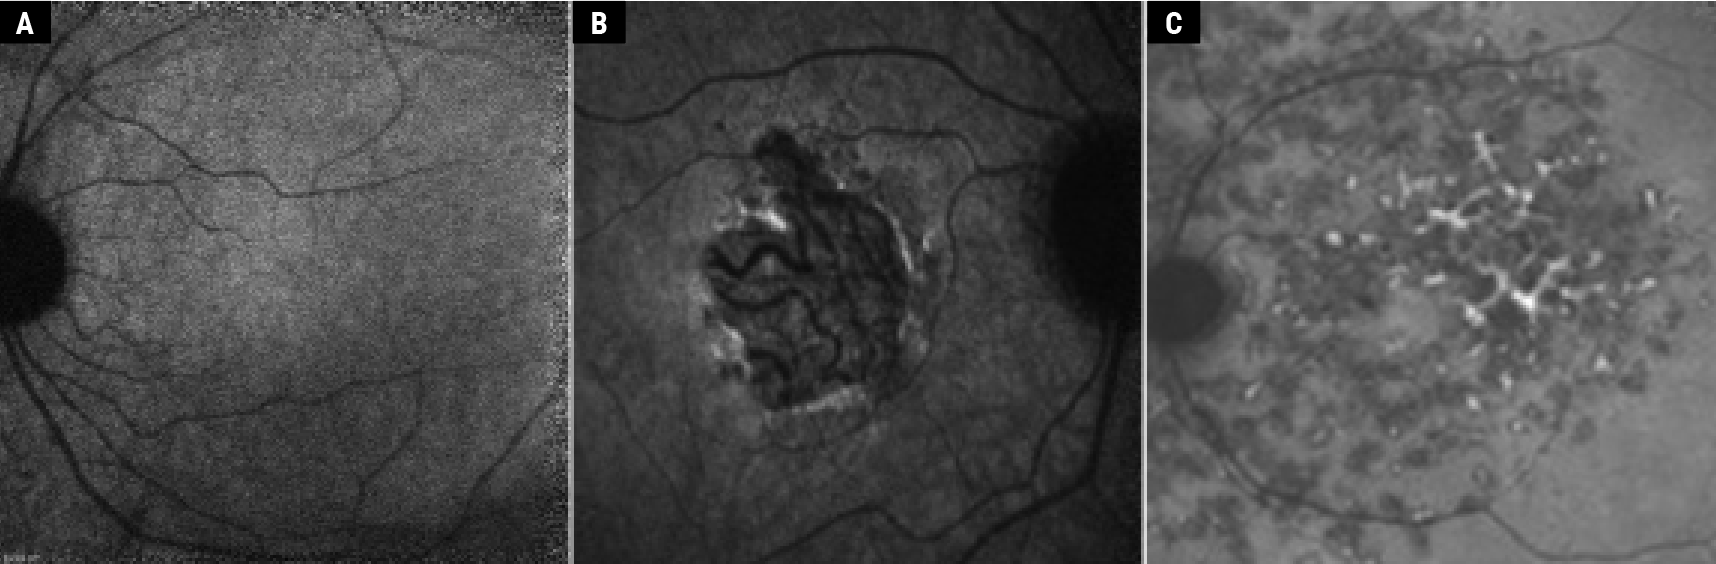 |
| Figure 2. Near-infrared autofluorescence. Normal fundus (A), dry AMD (B) and Stargardt’s disease (C), the same patient as in Fig. 1C; adapted from Jeffery et al.14 Copyright license for Fig. 2B: http://creativecommons.org/licenses/by-nc/4.0/. Images have not been modified from original publication. |
Near-Infrared (NIR) Autofluorescence
This is an in-vivo imaging technique that uses excitation at 787 nm and emission (>830 nm) beyond the red end of the visible spectrum. The fluorophores examined by NIR-AF are melanin and melanolipofuscin,15,16 with a major contribution from RPE and a smaller contribution from the choroid. The antioxidant properties of melanin are believed to have a protective effect on the eye with AMD. Melanin helps delay the accumulation of lipofuscin in the retina and choroid. In healthy eyes and contrary to blue AF, the NIR-AF signal is maximal in the foveal area, which has a horizontal width of 8.8 degrees.11 This is due to a larger concentration of RPE cells in the foveal area, and no absorption of emitted NIR-AF signal by macular pigments (See Figure 2A).7 Some studies suggest that melanin becomes AF in NIR following oxidization,15 with an increase of NIR-AF signal in aging patients17,18 and at the border of atrophic lesions in AMD patients (Figure 2B).19,20
While blue AF requires a strong blue illumination, NIR-AF uses a laser source above 750 nm, which is a faint red light, well-tolerated by patients. This allows the potential of longer imaging times (~30 seconds) with adapted set-ups, mainly adaptive optics SLO (AOSLO), to characterize RPE at a cellular scale using their NIR-AF potential.21–23
Short wavelength (SW)-AF and NIR-AF have complementary roles in evaluation of lipofuscin and melanin, and their role in AMD pathogenesis. SW-AF failed to detect geographic atrophy in 24 percent of the eyes with GA. With the introduction of Syfovre (pegcetacoplan, Apellis) and Izervay (avacincaptad pegol), c5 complement inhibitors for arresting GA progression, NIR-AF seems to have more promise. The use of AF in these clinical trials plays an important role, and thus missing 24 percent of GA would have a significant impact on these trials and outcomes.24,25 NIR-AF helps detect changes earlier than SW-AF in patients with GA. The fovea appears hypoAF in blue AF due to macular xanthophyll pigments absorbing the blue light, whereas on NIR-AF, the fovea is brighter than the parafoveal region due to increased melanin content and a lack of NIR filtering by macular xanthophylls. Hence, SW-AF may overestimate GA in the foveal area and underestimate it in the extrafoveal area. Therefore, some suggest to use NIR-AF in conjunction with SW-AF for monitoring patients with GA.24,26
Interestingly, in ABCA4 diseases (with elevated lipofuscin levels), lipofuscin fluorophores are noted to contribute to NIR-AF signals and are thought to be melanolipofuscin-associated fluorophores (See Figure 2C).10,11,14
Fluorescence Lifetime Imaging Ophthalmoscopy (FLIO)
FLIO is a relatively novel imaging tool that’s gained interest in the ophthalmic community and has shown promise in diagnosis and monitoring of various retinal disorders. Fluorescence lifetime imaging has been used in vivo for cancer diagnosis and skin evaluation. It’s used by the Heidelberg Spectralis system and has been shown to provide additional information when compared to traditional imaging techniques. Essentially, it measures the lifetime of fluorescence emitted by certain fluorophores within the eye, allowing for detection of subtle changes in metabolic as well as cellular activity.27
In FLIO, a short burst of light is used to excite certain molecules in the eye and then the system measures the time taken for the decay of the fluorescence from those molecules. AF lifetimes are excited at 473 nm and the device detects fluorescence decay in two separate wavelength channels. The long spectral channel (LSC), or red emission fluorescence (560 to 790 nm), records information from lipofuscin, while the short spectral channel (SSC)/green emission fluorescence (498 to 560 nm) records information from other fluorophores, including nicotinamide adenine dinucleotide (NAD), flavin adenine dinucleotide (FAD) and retinal carotenoids.27,28 Lens fluorescence impedes SSC, while LSC is relatively unaffected. It typically images an area of 30 degrees (256 x 256 pixels or 9 x 9 mm). A signal threshold of ~1,000 photons per pixel is essential for a good quality FLIO imaging, and it takes a total of two minutes per eye. FLIO lifetimes (FLTs) are intensity independent, and FLT can be both prolonged or shortened in areas of low or high FAF intensity. An extensive literature review found that FLIO was particularly useful for four retinal conditions so far: AMD; Stargardt’s disease; hydroxychloroquine toxicity; and macular telangiectasia type 2.27
A ring-shaped pattern (1.5 to 3 mm from the fovea) of prolonged FLTs can be observed consistent with changes of AMD, even before the hallmark signs of drusen appear, helping to distinguish between ambiguous cases of AMD and other retinal diseases. Stargardt’s disease typically lacks prolonged FLTs and absence of ring shaped pattern of FLTs differentiates it from AMD.29 The flecks in Stargardt’s disease can be detected a year prior to being noticed on other imaging modalities. This early detection can not only help in prognosis but also aid in clinical trials.
In cases of MacTel2, a temporal crescent or ring-shaped pattern of prolonged FLTs are typically noted in an area called the MacTel2 zone (oval area 9 degrees vertical and 5 degrees horizontal, centered on the fovea).30
FLIO has shown to detect hydroxychloroquine toxicity at an early stage, prior to structural changes. A typical pattern of prolonged FLTs, more pronounced on the SSC channel, can aid in early and easier detection of toxicity than multifocal ERGs. However, a complex fitting process and image analysis are a challenge at this stage for its use in clinical settings. This modality holds much promise in its application in a variety of retinal conditions in the future.
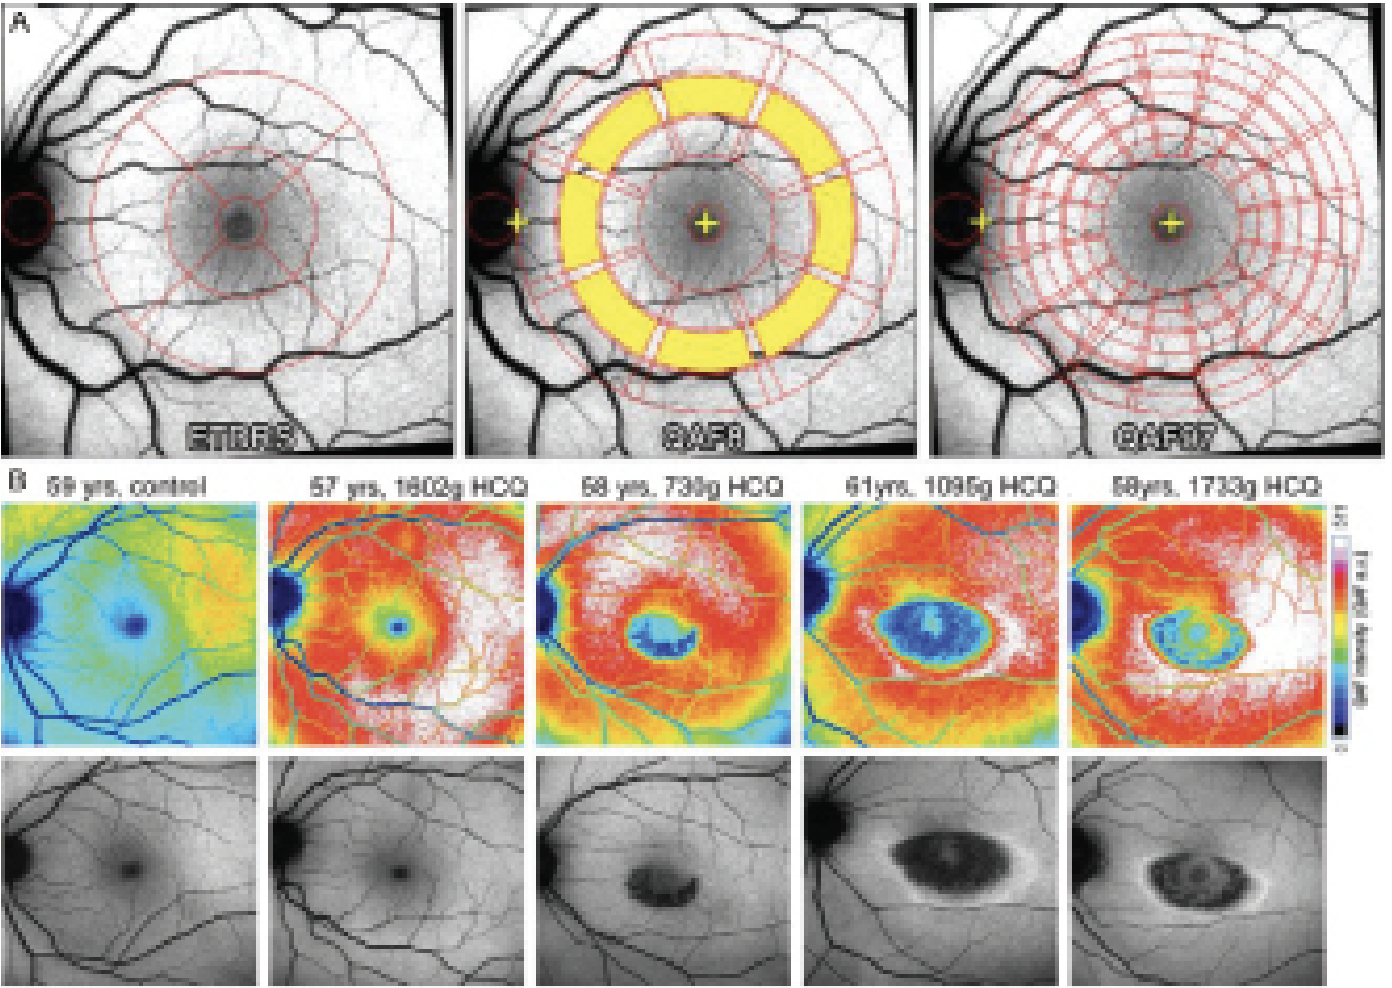 |
| Figure 3. Quantitative autofluorescence. A: Different patterns used to measure qAF to different precision degree (adapted from Kleefeld et al.)31 B: Example from different patients treated with hydroxychloroquine (HCQ) at different doses (adapted from Reichel et al).32 Copyright license for Figs. 3A and B: http://creativecommons.org/licenses/by-nc/4.0/. Images have not been modified from original publication. |
Quantitative Autofluorescence (qAF)
Conventional AF images record spatial distribution of the AF signal with designated pixel grayscale values between 0 and 255. A qualitative description of signal modulation has helped in the diagnosis and monitoring in various retinal disorders. However, with advances in technology, additional information could be acquired though a quantitative approach. The qAF approach measures the intensity of SW-AF along with spatial information, which allows for the distinction between disease-related changes from the normal age-related increase in retinal/RPE lipofuscin.12 By enabling comparison of AF intensities between individuals, and by using internal reference for long term follow-up, qAF helps address the shortcomings of conventional AF.31
Confocal SLO with a 30 x 30-degree field, 488 nm excitation and an emission range of 500 to 680 nm are used in a standardized approach for measuring qAF. A formula published by Dr. Delori’s group12 is used to calculate qAF values. Selected images are aligned, averaged and saved in a non-normalized format. Different patterns can be used for the comparison of different retinal zones with different degrees of precision (Figure 3A). Trained and skilled operators as well as good quality images are essential for obtaining reliable qAF. Quantitative AF increases with increasing eccentricity 10 to 15 degrees from the fovea, with maximal values noted supero-temporally. qAF also differs among healthy individuals and is difficult to compare from one patient to another.12,31,33 It’s higher in females and whites; and lower in blacks and Asians likely due to increased melanin pigmentation in the RPE and the choroid. A non-linear rise in AF is observed between the ages 20 and 70. Repeatability in healthy eyes between two sessions was observed to differ by more than 6 to 11 percent on 5 percent of the occasions. Similar repeatability was observed in recessive Stargardt’s (10 percent) and Best vitelliform macular dystrophy (7 percent).34 Early and intermediate AMD patients had lower qAF values compared to healthy individuals.35 These qAF values in AMD patients were reliable and repeatable not just on the same day, but on follow-up visits at three and six months as well.
The widespread use of qAF is currently hindered because it requires a trained operator, installation of an internal fluorescent reference as well as appropriate software. Despite these limitations, qAF has enhanced the understanding of lipofuscin-related retinal disorders. A group led by Columbia University researcher Janet Sparrow, PhD,11 highlighted qAF’s utility in genotype-phenotype correlations as well as in guiding clinical diagnosis and genetic testing. It has the potential to serve as a biomarker for disease risk and progression (such as during chloroquine maculopathy,32 [Figure 3B]). They also believe that qAF can reflect visual cycle activity in various retinal diseases. If researchers and manufacturers can make this a technically less challenging process that’s easier to integrate into routine clinical practice, it may be able to enhance patient care to a great degree.
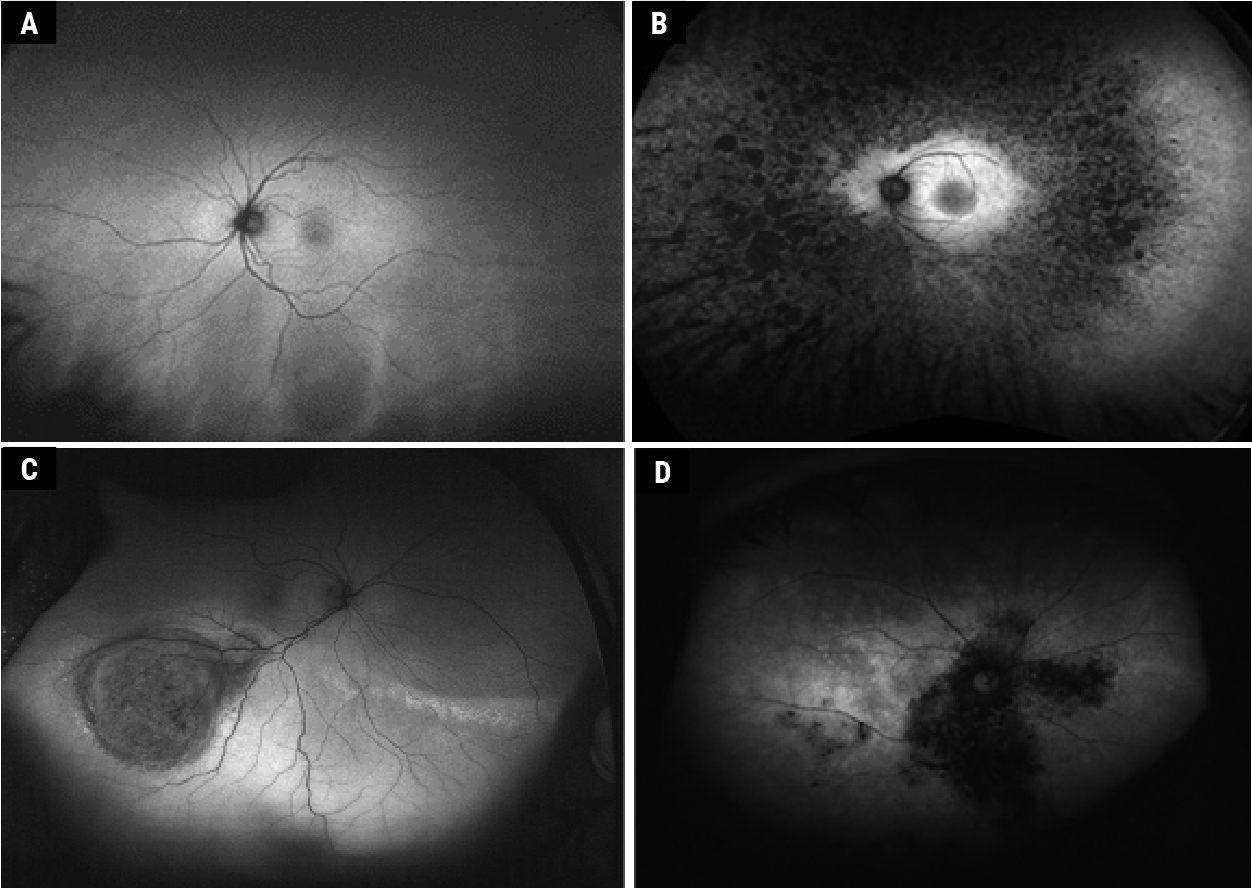 |
| Figure 4. Widefield autofluorescence with Optos system. Normal fundus (A) (adapted from Ly et al13). Retinitis pigmentosa (B) (adapted from Cicinelli et al51). Choroidal melanoma (C) (adapted from Callaway et al41. Birdshot chorioretinopathy (D) (adapted from Le Piffer et al40). Copyright license for Fig. 4, A, B and C: http://creativecommons.org/licenses/by-nc/4.0/. Images have not been modified from original publication. |
Widefield Autofluorescence
Widefield imaging is defined by a field of view greater than 50 degrees, and “ultra-widefield” is greater than 100 degrees.36 A field of view up to 267 degrees can be obtained thanks to montaging of different photographs. Clarus 500 (Zeiss) allows a field of view of 200 degrees by combining two 133-degree images, with blue and NIR-AF. Mirante (Nidek) has a field of view of 163 degrees and can perform multimodal imaging. Contact lenses can allow larger fields of view on a single image, but require the patient’s cooperation. The Heidelberg Spectralis imaging system uses the confocal scanning laser ophthalmoscope to obtain a 150-degree field of view with a contact lens attachment, allowing blue and NIR-AF. The Optomap ultra-widefield system (blue and NIR-AF) can obtain non-contact images of 82 percent of the retinal surface or up to a 200-degree field of view, but with spatial distortion. This system uses green AF (532 nm laser for excitation and 570 to 780 nm for the emission filter37 [Figures 3 and 4]), making it difficult to compare with other devices, and unable to distinguish between lipofuscin-like fluorophores (blue AF) or melanin-like fluorophores (NIR-AF). It combines cSLO with an ellipsoid mirror to allow ultra-widefield imaging. The latter has two focal points, one close to the mirror and the second near the pupillary plane. Imaging through undilated pupils, short acquisition time (250 ms), and relatively better penetration through media opacity are additional advantages of the imaging system.38,39
With better imaging modalities, we’re now able to unearth many peripheral retinal manifestations of predominantly posterior pole diseases. For instance, peripheral AF abnormalities were noted in 63 to 69 percent of AMD cases. Central serous chorioretinopathy and Vogt Koyanagi Harada syndrome also had peripheral AF changes in 57 percent and 70 percent, respectively.38 Other uveitidies40 (Figure 4B), choroidal tumors41 (Figure 4C), retinal detachment and retinoschisis42 have shown peripheral AF changes also. There are limitations to evaluating widefield AF, since AF peripheral abnormalities aren’t always disease-specific. For example, both healthy and AMD patients had peripheral AF abnormalities,43 and AF often can’t distinguish between peripheral RD or retinoschisis.44 However, widefield systems are beneficial for specific peripheral diseases such as inherited retinal diseases (Figure 4D). Standardized grading systems and genotype-phenotype correlations in different RP genotypes were formulated using ultra-widefield FAF systems.45–47 Similarly, atrophy expansion rates and age-dependent changes in the total lesion size were demonstrated using UWF-AF in patients with ABCA4 mutations.48–50 Future studies with this tool can highlight the clinical relevance of these peripheral changes and may thereby alter management guidelines.
In conclusion, fundus autofluorescence imaging has come a long way in recent years and continues to prove its worth as an invaluable tool for clinicians. Its expanding role in various retinal diseases, along with the emergence of newer imaging modalities such as FLIO and qAF, only serve to further highlight its potential. With continued advancements in technology and efforts to make these techniques more user-friendly, these modalities can have a wider use in clinical practice. Widefield AF has provided insights into the peripheral changes of diseases which were previously considered to have macular manifestations only. We believe that this imaging modality will continue to provide critical insights into the pathogenesis, diagnosis and management of retinal diseases, and should remain an essential adjunct tool in the armamentarium of clinicians.
Dr. Borella is an ophthalmology resident and PhD candidate at the Department of Ophthalmology, University of Pittsburgh School of Medicine, and the Vision Institute, 15-20 National Ophthalmology Hospital and Sorbonne University in Paris, France.
Dr. Vaidya practices at Dr. Vaidya Eye Hospital in Mumbai, India. Drs. Borella and Vaidya are co-first authors.
Dr. Chhablani is a Professor of Ophthalmology at the University of Pittsburgh School of Medicine.
Dr. Yonekawa is an assistant professor of ophthalmology at Sidney Kimmel Medical College at Thomas Jefferson University. He serves on the Education Committee of the American Society of Retina Specialists and on the Executive Committee for the Vit Buckle Society, where he is also the vice president for academic programming.
1. Croce AC, Bottiroli G. Autofluorescence spectroscopy and imaging: A tool for biomedical research and diagnosis. Eur J Histochem 2014;58:4:2461.
2. Kellner U, Kellner S, Weinitz S. Fundus autofluorescence (488 nm) and near-infrared autofluorescence (787 NM) visualize different retinal pigment epithelium alterations in patients with age-related macular degeneration. Retina 2010;30:1:6–15.
3. Schmitz-Valckenberg S, Pfau M, Fleckenstein M, Staurenghi G, Sparrow JR, Bindewald-Wittich A, Spaide RF, Wolf S, Sadda SR, Holz FG. Fundus autofluorescence imaging. Prog Retin Eye Res 2021;81:100893.
4. Gabai A, Veritti D, Lanzetta P. Fundus autofluorescence applications in retinal imaging. Indian J Ophthalmol 2015;63:5:406–415.
5. Delori FC, Dorey CK, Staurenghi G, Arend O, Goger DG, Weiter JJ. In vivo fluorescence of the ocular fundus exhibits retinal pigment epithelium lipofuscin characteristics. Invest Ophthalmol Vis Sci 1995;36:3:718–729.
6. Spaide R. Autofluorescence from the outer retina and subretinal space: Hypothesis and review. Retina 2008;28:1:5–35.
7. Fischer J, Otto T, Delori F, Pace L, Staurenghi G. Scanning laser ophthalmoscopy (SLO). In: Bille JF, ed. High Resolution Imaging in Microscopy and Ophthalmology: New Frontiers in Biomedical Optics. Chicago: Springer Cham, 2019.
8. Meleppat RK, Ronning KE, Karlen SJ, Kothandath KK, Burns ME, Pugh EN Jr, Zawadzki RJ. In situ morphologic and spectral characterization of retinal pigment epithelium organelles in mice using multicolor confocal fluorescence imaging. Investigative Ophthalmology & Visual Science 2020;61:13:1.
9. Tsang SH, Sharma T. Fundus autofluorescence. Adv Exp Med Biol 2018 1085;15–16.
10. Sparrow JR, Gregory-Roberts E, Yamamoto K, Blonska A, Ghosh SK, Ueda K, Zhou J. The bisretinoids of retinal pigment epithelium. Prog Retin Eye Res 2012;31:2:121–135.
11. Sparrow JR, Duncker T, Schuerch K, Paavo M, de Carvalho JRL. Lessons learned from quantitative fundus autofluorescence. Prog Retin Eye Res 2020;74:100774.
12. Delori F, Greenberg JP, Woods RL, Fischer J, Duncker T, Sparrow J, Smith RT. Quantitative measurements of autofluorescence with the scanning laser ophthalmoscope. Invest Ophthalmol Vis Sci 2011;52:13:9379–9390.
13. Ly A, Nivison-Smith L, Assaad N, Kalloniatis M. Fundus autofluorescence in age-related macular degeneration. Optom Vis Sci 2017;94:2:246–259.
14. Jeffrey R, Chen F. Stargardt Disease: Multimodal imaging: A review. Clinical & experimental ophthalmology 2021;49:5.
15. Sarna T, Burke JM, Korytowski W, Rózanowska M, Skumatz CMB, Zareba A, Zareba M. Loss of melanin from human RPE with aging: Possible role of melanin photooxidation. Exp Eye Res 2003;76:1:89–98.
16. Lapierre-Landry M, Carroll J, Skala MC. Imaging retinal melanin: A review of current technologies. J Biol Eng 2018;12:29.
17. Boulton M, Docchio F, Dayhaw-Barker P, Ramponi R, Cubeddu R. Age-related changes in the morphology, absorption and fluorescence of melanosomes and lipofuscin granules of the retinal pigment epithelium. Vision Res 1990;30:9:1291–1303.
18. Taubitz T, Fang Y, Biesemeier A, Julien-Schraermeyer S, Schraermeyer U. Age, lipofuscin and melanin oxidation affect fundus near-infrared autofluorescence. EBioMedicine 2019;48:592–604.
19. Bonilha VL, Bell BA, Hu J, Milliner C, Pauer GJ, Hagstrom SA, Radu RA, Hollyfield JG. Geographic atrophy: Confocal scanning laser ophthalmoscopy, histology, and inflammation in the region of expanding lesions. Invest Ophthalmol Vis Sci 2020;61:8:15.
20. Paques M, Norberg N, Chaumette C, Sennlaub F, Rossi E, Borella Y, Grieve K. Long term time-lapse imaging of geographic atrophy: A pilot study. Frontiers in Medicine 2022;9.
21. Grieve K, Gofas-Salas E, Ferguson RD, Sahel JA, Paques M, Rossi EA. In vivo near-infrared autofluorescence imaging of retinal pigment epithelial cells with 757 nm excitation. Biomed Opt Express 2018;9:12:5946–5961.
22. Vienola KV, Zhang M, Snyder VC, Sahel JA, Dansingani KK, Rossi EA. Microstructure of the retinal pigment epithelium near-infrared autofluorescence in healthy young eyes and in patients with AMD. Sci Rep 2020;10:1:9561.
23. Rossi EA, Rangel-Fonseca P, Parkins K, Fischer W, Latchney LR, Folwell MA, Williams DR, Dubra A, Chung M M. In vivo imaging of retinal pigment epithelium cells in age related macular degeneration. Biomed Opt Express 2013;4:11:2527–2539.
24. Pilotto E, Vujosevic S, Melis R, Convento E, Sportiello P, Alemany-Rubio E, Segalina S, Midena E. Short wavelength fundus autofluorescence versus near-infrared fundus autofluorescence, with microperimetric correspondence, in patients with geographic atrophy due to age-related macular degeneration. Br J Ophthalmol 2011;95:8:1140–1144.
25. Heiferman MJ, Fawzi AA. Discordance between blue-light autofluorescence and near-infrared autofluorescence in age-related macular degeneration. Retina 2016;36 (Suppl 1):S137–S146.
26. Forte R, Querques G, Querques L, Massamba N, Le Tien V, Souied EH. Multimodal imaging of dry age-related macular degeneration. Acta Ophthalmol 2012;90:4:e281-287.
27. Sauer L, Vitale AS, Modersitzki NK, Bernstein PS. Fluorescence lifetime imaging ophthalmoscopy: Autofluorescence imaging and beyond. Eye (Lond) 2021;35:1:93–109.
28. Dysli C, Wolf S, Berezin MY, Sauer L, Hammer M, Zinkernagel MS. Fluorescence lifetime imaging ophthalmoscopy. Prog Retin Eye Res 2017;60:120–143.
29. Sauer L, Gensure RH, Andersen KM, Kreilkamp L, Hageman GS, Hammer M, Bernstein PS. Patterns of fundus autofluorescence lifetimes in eyes of individuals with nonexudative age-related macular degeneration. Invest Ophthalmol Vis Sci 2018;59:4:AMD65–AMD77.
30. Sauer L, Gensure RH, Hammer M, Bernstein PS. Fluorescence lifetime imaging ophthalmoscopy: A novel way to assess macular telangiectasia type 2. Ophthalmol Retina 2018;2:6:587–598.
31. Kleefeldt N, Bermond K, Tarau IS, Hillenkamp J, Berlin A, Sloan KR, Ach T. Quantitative fundus autofluorescence: Advanced analysis tools. Translational Vision Science & Technology 2020;9:8:2.
32. Reichel C, Berlin A, Radun V, Tarau IS, Hillenkamp J, Kleefeldt N, Sloan KR, Ach T. Quantitative fundus autofluorescence in systemic chloroquine/hydroxychloroquine therapy. Transl Vis Sci Technol 2020;9:9:42.
33. Greenberg JP, Duncker T, Woods RL, Smith RT, Sparrow JR, Delori FC. Quantitative fundus autofluorescence in healthy eyes. Investigative Ophthalmology & Visual Science 2013;54:8:5684–5693.
34. Reiter GS, Told R, Baratsits M, Hecht A, Schlanitz FG, Sacu S, Schmidt-Erfurth U. Repeatability and reliability of quantitative fundus autofluorescence imaging in patients with early and intermediate age-related macular degeneration. Acta Ophthalmol 2019;97:4:e526–e532.
35. Gliem M, Müller PL, Finger RP, McGuinness MB, Holz FG, Charbel-Issa P. Quantitative fundus autofluorescence in early and intermediate age-related macular degeneration. JAMA Ophthalmol 2016;134:7:817–824.
36. Kumar V, Surve A, Kumawat D, Takkar B, Azad S, Chawla R, Shroff D, Arora A, Singh R, Venkatesh P. Ultra-wide field retinal imaging: A wider clinical perspective. Indian J Ophthalmol 2021;69:4:824–835.
37. Oishi A, Oishi M, Ogino K, Morooka S, Yoshimura N. Wide-field fundus autofluorescence for retinitis pigmentosa and cone/cone-rod dystrophy. Adv Exp Med Biol 2016;854:307–313.
38. Xu A, Chen C. Clinical application of ultra-widefield fundus autofluorescence. Int Ophthalmol 2021;41:2:727–741.
39. Bhambra N, Francisconi CLM, Marafon SB, Figueiredo NA, Juncal VR, Brosh K, Hillier RJ, Muni RH. A novel method of quantifying retinal displacement using ultra-widefield fundus autofluorescence imaging. Am J Ophthalmol 2022;244:1–10.
40. Piffer ALL, Boissonnot M, Gobert F, Zenger A, Wolf S, Wolf U, Korobelnik JF, Rougier MB. Relevance of wide-field autofluorescence imaging in birdshot retinochoroidopathy: Descriptive analysis of 76 eyes. Acta Ophthalmologica 2014;92:6:e463–e469.
41. Callaway NF, Mruthyunjaya P. Widefield imaging of retinal and choroidal tumors. Int J Retina Vitreous 2019;5 (Suppl 1):49.
42. Navaratnam J, Salvanos P, Vavvas DG, Bragadóttir R. Ultra-widefield autofluorescence imaging findings in retinoschisis, rhegmatogenous retinal detachment and combined retinoschisis retinal detachment. Acta Ophthalmol 2021;99:2:195–200.
43. Guduru A, Fleischman D, Shin S, Zeng D, Baldwin JB, Houghton OM, Say EA. Ultra-widefield fundus autofluorescence in age-related macular degeneration. PLoS One 2017;12:6:e0177207.
44. Cao JL, Conti TF, Hom GL, Babiuch AS, Greenlee T, Ehlers JP, Rachitskaya A, Sharma S, Yuan A, Kaiser PK, Singh RP. Comparative assessment of widefield fundus autofluorescence patterns in retinoschisis and retinal detachment. J Vitreoretin Dis 2020;4:4:286–292.
45. Patal R, Banin E, Batash T, Sharon D, Levy J. Ultra-widefield fundus autofluorescence imaging in patients with autosomal recessive retinitis pigmentosa reveals a genotype-phenotype correlation. Graefes Arch Clin Exp Ophthalmol 2022;260:11:3471–3478.
46. Hariri AH, Gui W, Datoo O’Keefe GA, Ip MS, Sadda SR, Gorin MB. Ultra-widefield fundus autofluorescence imaging of patients with retinitis pigmentosa: A standardized grading system in different genotypes. Ophthalmol Retina 2018;2:7:735–745.
47. Trichonas G, Traboulsi EI, Ehlers JP. Ultra-widefield fundus autofluorescence patterns in retinitis pigmentosa and other retinal dystrophies. Ophthalmic Genet 2017;38:1:98–100.
48. Heath Jeffery RC, Thompson JA, Lamey TM, McLaren TL, McAllister IL, Constable IJ, Mackey DA, De Roach JN, Chen FK. Classifying ABCA4 mutation severity using age-dependent ultra-widefield fundus autofluorescence-derived total lesion size. Retina 2021;41:12:2578–2588.
49. Heath Jeffery RC, Thompson JA, Lo J, Lamey TM, McLaren TL, McAllister IL, Mackey DA, Constable IJ, De Roach JN, Chen FK. Atrophy expansion rates in Stargardt disease using ultra-widefield fundus autofluorescence. Ophthalmol Sci 2021;1:1:100005.
50. Klufas MA, Tsui I, Sadda SR, Hosseini H, Schwartz SD. Ultrawidefield autofluoresence in ABCA4 STARGARDT disease. Retina 2018;38:2:403–415.
51. Cicinelli MV, Marchese A, Bordato A, Manitto MP, Bandello F, Battaglia Parodi M. Reviewing the role of ultra-widefield imaging in inherited retinal dystrophies. Ophthalmol Ther 2020;9:2:249–263.