Are dry eyes "blurry" eyes? Dry eye affects nearly one out of every five people in the United States.1 In addition to ocular discomfort and irritation, dry-eye patients report blurring of vision as one of their associated symptoms. Recently, the impact of blurring related to dry eye has received greater attention, primarily due to its likely impact on visual function. Do your patients complain of blurry eyes? Did you know that this could be a symptom of dry-eye disease? This month, we will review some of the latest visual function tests and their clinical significance for you and your patients.
The environment plays a major role in the severity of dry-eye symptoms. With each season comes a whole host of new external factors such as the low humidity of air-conditioned spaces in the summer, dry indoor heating in the winter, as well as dust, wind and pollen changes in the outdoor air throughout the year. These seasonal changes impact dry-eye sufferers. Additional factors such as the wearing of contact lenses, hormonal imbalance, autoimmune disease, use of many widely prescribed systemic medications, anatomical changes or trauma, and aging also have an impact on dry-eye symptoms.2 Symptoms tend to result in mildly decreased quality of life, and, with increasing severity, loss of function and productivity.3,4
Experimentally, patients suffering from early-stage dry eye have been found to have an increased blink rate (34.1 blinks/min) compared to controls (20.1 blinks/min).5 Tear-film instability and rapid tear-film breakup times are the probable causes for this increase in blink rate. However, further research has demonstrated that up to 42 percent of dry-eye patients have reduced corneal sensitivity, which causes these patients to blink less frequently, leaving the ocular surface even more susceptible to both blurring and damage from desiccation (Nally L, et al. IOVS 2003; 44:ARVO E-Abstract 2488).
Clinically, a stable tear film and a smooth corneal surface, devoid of keratitis, create the necessary environment for good visual imaging.6 As such, patients with dry eye are also more susceptible to eye fatigue, due to their less protected ocular surface (resulting from the shorter TFBUT and greater corneal staining) and increased blinking, than are normal individuals (Ousler GW, et al. IOVS 2002; 43:ARVO E-Abstract 56).
Dry-eye patients experience decreased visual acuity when they engage in activities such as reading, driving, watching TV and typing (Pollard S, et al. IOVS 2004;45:ARVO E-Abstract 82). As the tear film breaks up at a rapid rate in dry-eye patients, visual acuity too may decrease, causing the patient to blink in order to restore the tear film. In patients with central keratitis, the rough central corneal surface may further exacerbate both the TFBUT and decrease in visual function during the inter-blink interval. As such, it is necessary to develop a fast and accurate functional visual acuity test in order to measure visual acuity during the inter-blink interval in patients with dry eye as compared to controls, and within the dry-eye population, to compare those with and without central keratitis. Such a functional test is crucial in order to quantify any decay in visual acuity between blinks.
A recent study conducted in our lab at Ophthalmic Research Associates demonstrates that patients with central corneal staining have worse visual acuity scores compared to those patients without central staining. This is not surprising since it is the central portion of the cornea through which we see and there are clear anatomical, physiological and pathological differences between the central and peripheral corneas (as described in the August 2005 Therapeutic Topics, "Our Two Corneas"). Recognizing these differences is important for diagnosis and management of dry eye. Certain drugs, such as diquafosol, have already been shown to preferentially affect the central cornea (Kellerman DJ, et al. IOVS 2004;45:ARVO E-Abstract 3892), which could be an important mechanism of action when treating dry eye and associated loss of visual acuity.
Previously, researchers in dry eye and related areas have used various measures for testing visual acuity. In particular, researchers have measured standard visual acuity (Snellen, ETDRS), as well as contrast sensitivity.
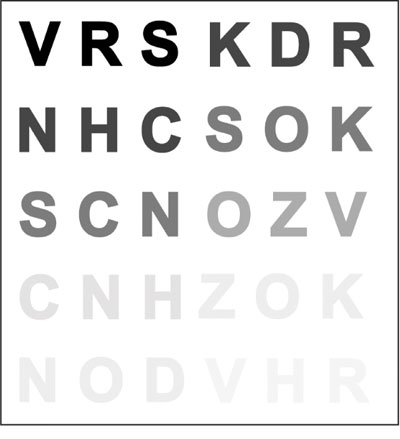
Developed nearly two decades after Heinrich Kuechler created the first set of visual acuity charts in 1843, in 1862 Dr. Hermann Snellen, a Dutch ophthalmologist, developed what remains the most commonly used eye chart in doctors' offices today. Snellen notation is the ratio of the test distance to the distance at which the smallest letter read subtends an angle of 5 arcminutes. Figure 1. The Pelli-Robson contrast sensitivity chart determines the contrast required to read large letters of a fixed size.
In research, however, a different chart has become the norm. The ETDRS chart, initially used in the Early Treatment of Diabetic Retinopathy Study, was specifically designed to be more accurate than the Snellen tests. That is, the ETDRS chart included the same number of letters per row (five), equal spacing between the rows on a log scale (0.1 log unit), equal spacing of the letters on a log scale and each row equated for letter difficulty.
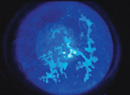
Despite these advantages, the ETDRS eye chart measures visual acuity with high-contrast letters at 100-percent reflectance, offering almost 100-percent contrast. Yet, in everyday life experiences, such high-contrast visual stimuli are not common. In fact, objects of interest in the real world tend to appear only at 18 percent reflectance, and the contrast between objects and their backgrounds is much less than the ideal 100 percent. For this reason, the contrast sensitivity chart measures a patient's ability to detect differences in borders, edges and brightness. In particular, the Pelli-Robson test is often used to measure contrast sensitivity. This chart shows changes in the contrast of optotypes at 20/60 arranged six per line, and varied in contrast from high to low (See Figure 1).
Visual function, however, is much more than visual acuity. Despite the fact that research has come a long way since Heinrich Kuechler's eye charts, today's measurements still appear to be lacking in functional significance. To measure visual function, one must take into consideration fundamental components of everyday life: decay in visual acuity during the inter-blink interval; the rate at which someone can read information; and the impact of lighting levels and glare.
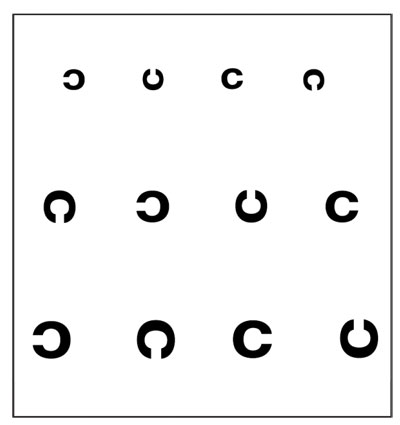
Real-time decay in visual acuity during the inter-blink interval that might cause someone discomfort, disorientation or reduction in functional productivity must be quantified in order to refine endpoints in clinical trials and improve diagnostics for treatment. In 2005, a group of researchers developed a functional visual task using the Landolt's "rotating Cs" in a computer-based paradigm.7 In the experiment, participants were administered an ocular anesthetic to reduce blinking while they responded to a series of tumbling Cs on the computer screen, indicating (by means of a small joystick press) which direction the opening of the C was pointing (up, down, left, right) (See Figure 2).
The Cs were presented at the participant's best corrected visual acuity and, when a mistake was made, the 'C' became one step larger. At 10-, 20- and 30-second intervals, the subject's visual acuity was recorded. Functional visual acuity was found to be different between subjects with dry eye and controls at all three time points.
Figure 2. Landolt's rotating 'C's are used in a computer-based test to measure patients' functional visual acuity.
Such a study opens the door to creating a real-time measure of visual acuity. Nevertheless, the current task lacks the essential real-time measurement (in the order of milliseconds) of visual function without the confounding presence of an ocular anesthetic agent.
We've investigated the possibility of improving upon this method. That is, rotating Cs are presented to subjects without the use of an ocular anesthetic in order to measure the decay in functional visual acuity (in real time) during a normal physiological state. Such a paradigm enables researchers to gather functionally accurate data from patients under simulated real-world conditions in a clinical setting.
Parallel to the rate of visual decay is the rate at which patients are able to read aloud a list or a menu. Visual inhibition during such a task might greatly impede the rate at which subjects can read each word. Therefore, functional reading must be measured. That is, the rate at which subjects are able to read not simply letters on a chart, but rather a series of unconnected words, can provide insight into the functional impairment of dry eye.
Finally, real-world lighting conditions and glare vary constantly and may impact functional acuity. Although these factors are partly considered in the Pelli-Robson contrast sensitivity test, there is still an additional and readily available measure of visual acuity under real lighting conditions. The Brightness Acuity Test, frequently used in cataract diagnosis, simulates lighting under three different conditions (in addition to the lighting provided naturally in your laboratory): 1) direct overhead sunlight (high glare); 2) partly cloudy day (medium glare); and 3) bright overhead commercial lighting (low glare). By using the BAT in conjunction with the ETDRS chart, contrast sensitivity chart, or other vision test, you can obtain a functional, everyday-life measure of visual acuity.
With all of these types of tasks, measuring visual function decay during the inter-blink interval in dry-eye patients is not out of reach. Pilot research we are presently conducting at ORA links these various testing measures together and has demonstrated the significance of measuring functional visual acuity.
We have been able to determine the role of decay in visual acuity during the inter-blink interval, as well as the impact of dry eye—in particular, central corneal staining—on the rate at which an individual can read under varying brightness conditions. Initial results such as these further demonstrate that functional visual acuity is an area deserving of considerable attention in upcoming research efforts.
As these tests become more sophisticated, widely used and commercially available, we will gain a greater understanding of the role that visual function plays in patients with a compromised ocular surface, such as with dry eye. Delving deeper into the realm of visual function in dry-eye patients and using more sensitive and refined clinical endpoints can also play a significant role in the drug development process.
Dr. Abelson, an associate clinical professor of ophthalmology at Harvard Medical School and senior clinical scientist at Schepens Eye Research Institute, consults in ophthalmic pharmaceuticals. Dr. Walker is a research associate, Mr. Ousler is director of the dry eye department, and Ms. Plumer manages medical communications at Ophthalmic Research Associates in North Andover.
1. Shaumberg DA, Sullivan DA, Dana MR. Epidemiology of Dry Eye Syndrome. In: Sullivan DA, Stern ME, Tsubota K, et al, eds. Lacrimal Gland, Tear Film, and Dry Eye Syndromes 3, Part B. New York: Plenum Press; 2002:989-98.
2. Lemp MA. Report of the National Eye Institute/Industry Workshop on Clinical Trials in Dry Eyes. CLAO J 1995;21:4.
3. Bron AJ. Diagnosis of dry eye. Surv Ophthalmol 2001;45:S221-6.
4. Lemp MA. Evaluation and differential diagnosis of keratoconjunctivitis sicca. J Rheumatol Suppl 2000;61:11-4.
5. Nakamori K, Odawara M, Nakajima T, Mizutani T, Tsubota K. Blinking is controlled primarily by ocular surface conditions. Am J Ophthalmol 1997;124:1:24-30.
6. Goto E, Yagi Y, Matsumoto Y, Tsubota K. Impaired functional visual acuity of dry eye patients. Am J Ophthalmol 2002;133:181-186.
7. Ishida R, Kojima T, Dogru M, et al. The application of a new continuous functional visual acuity measurement system in dry eye syndromes. Am J Ophthalmol 2005;139:253-258.