Since glaucoma is a progressive disease, physicians are constantly searching for reliable tools to monitor it over time. Before the introduction of optical coherence tomography, determination of glaucoma progression relied heavily on clinical assessment of the optic nerve, comparison of disc photos over time and visual field analysis. Although these remain key elements of the glaucoma evaluation, they’re still subjective and qualitative in nature, limiting their ability to detect progression reliably. In this article, we’ll provide tips on how to use the OCT devices we’re familiar with to monitor progression, and how to avoid artifacts and other errors that can lead you astray.
Anatomy and OCT
One major advantage of OCT is its ability to show detailed, quantitative information about the various retinal layers, which corresponds to tissue sections on a histology slide. Therefore, we’ll discuss the various tissue structures affected by glaucoma progression and then provide practical tips for using OCT to monitor them.
Glaucoma is characterized by loss of retinal ganglion cells and their axons, and by the remodeling of the optic nerve head, which manifests as neuroretinal rim narrowing, optic disc excavation and displacement of lamina cribrosa. The ONH is formed by the axons of the retinal ganglion cells, blood vessels and glial tissue. The axons exit the eye through the neural canal opening and are supported by the lamina cribrosa (essentially a connective tissue structure), which comprises the floor of the physiologic cup. In 1979, Harry Quigley, MD, and William R. Green, MD, demonstrated that the increased optic disc cup size was caused by the loss of retinal ganglion cells and their axons.1 In addition, the connective tissue in the ONH undergoes profound remodeling in glaucoma, leading to posterior deformation of the lamina cribrosa as well as expansion of anterior and posterior neural canal openings, as illustrated in an experimental monkey model of glaucoma.2 In addition to cupping of the optic nerve, glaucoma patients often show sectorial loss of nerve fiber layer, which can be visualized with a red-free light.
The correlation between anatomic structures and volumetric spectral domain-OCT images of the optic nerve head was made clear in a study by Nicholas Strouthidis, MD, and his colleagues at Devers Eye Institute, Oregon, when they performed SD-OCT imaging of the optic nerve head in monkeys and obtained thin histological sections of the same tissues.3 With side by side comparison, they were able to show that the reflectance patterns imaged by SD-OCT corresponded precisely to the various retinal layers.
Commonly Used Devices
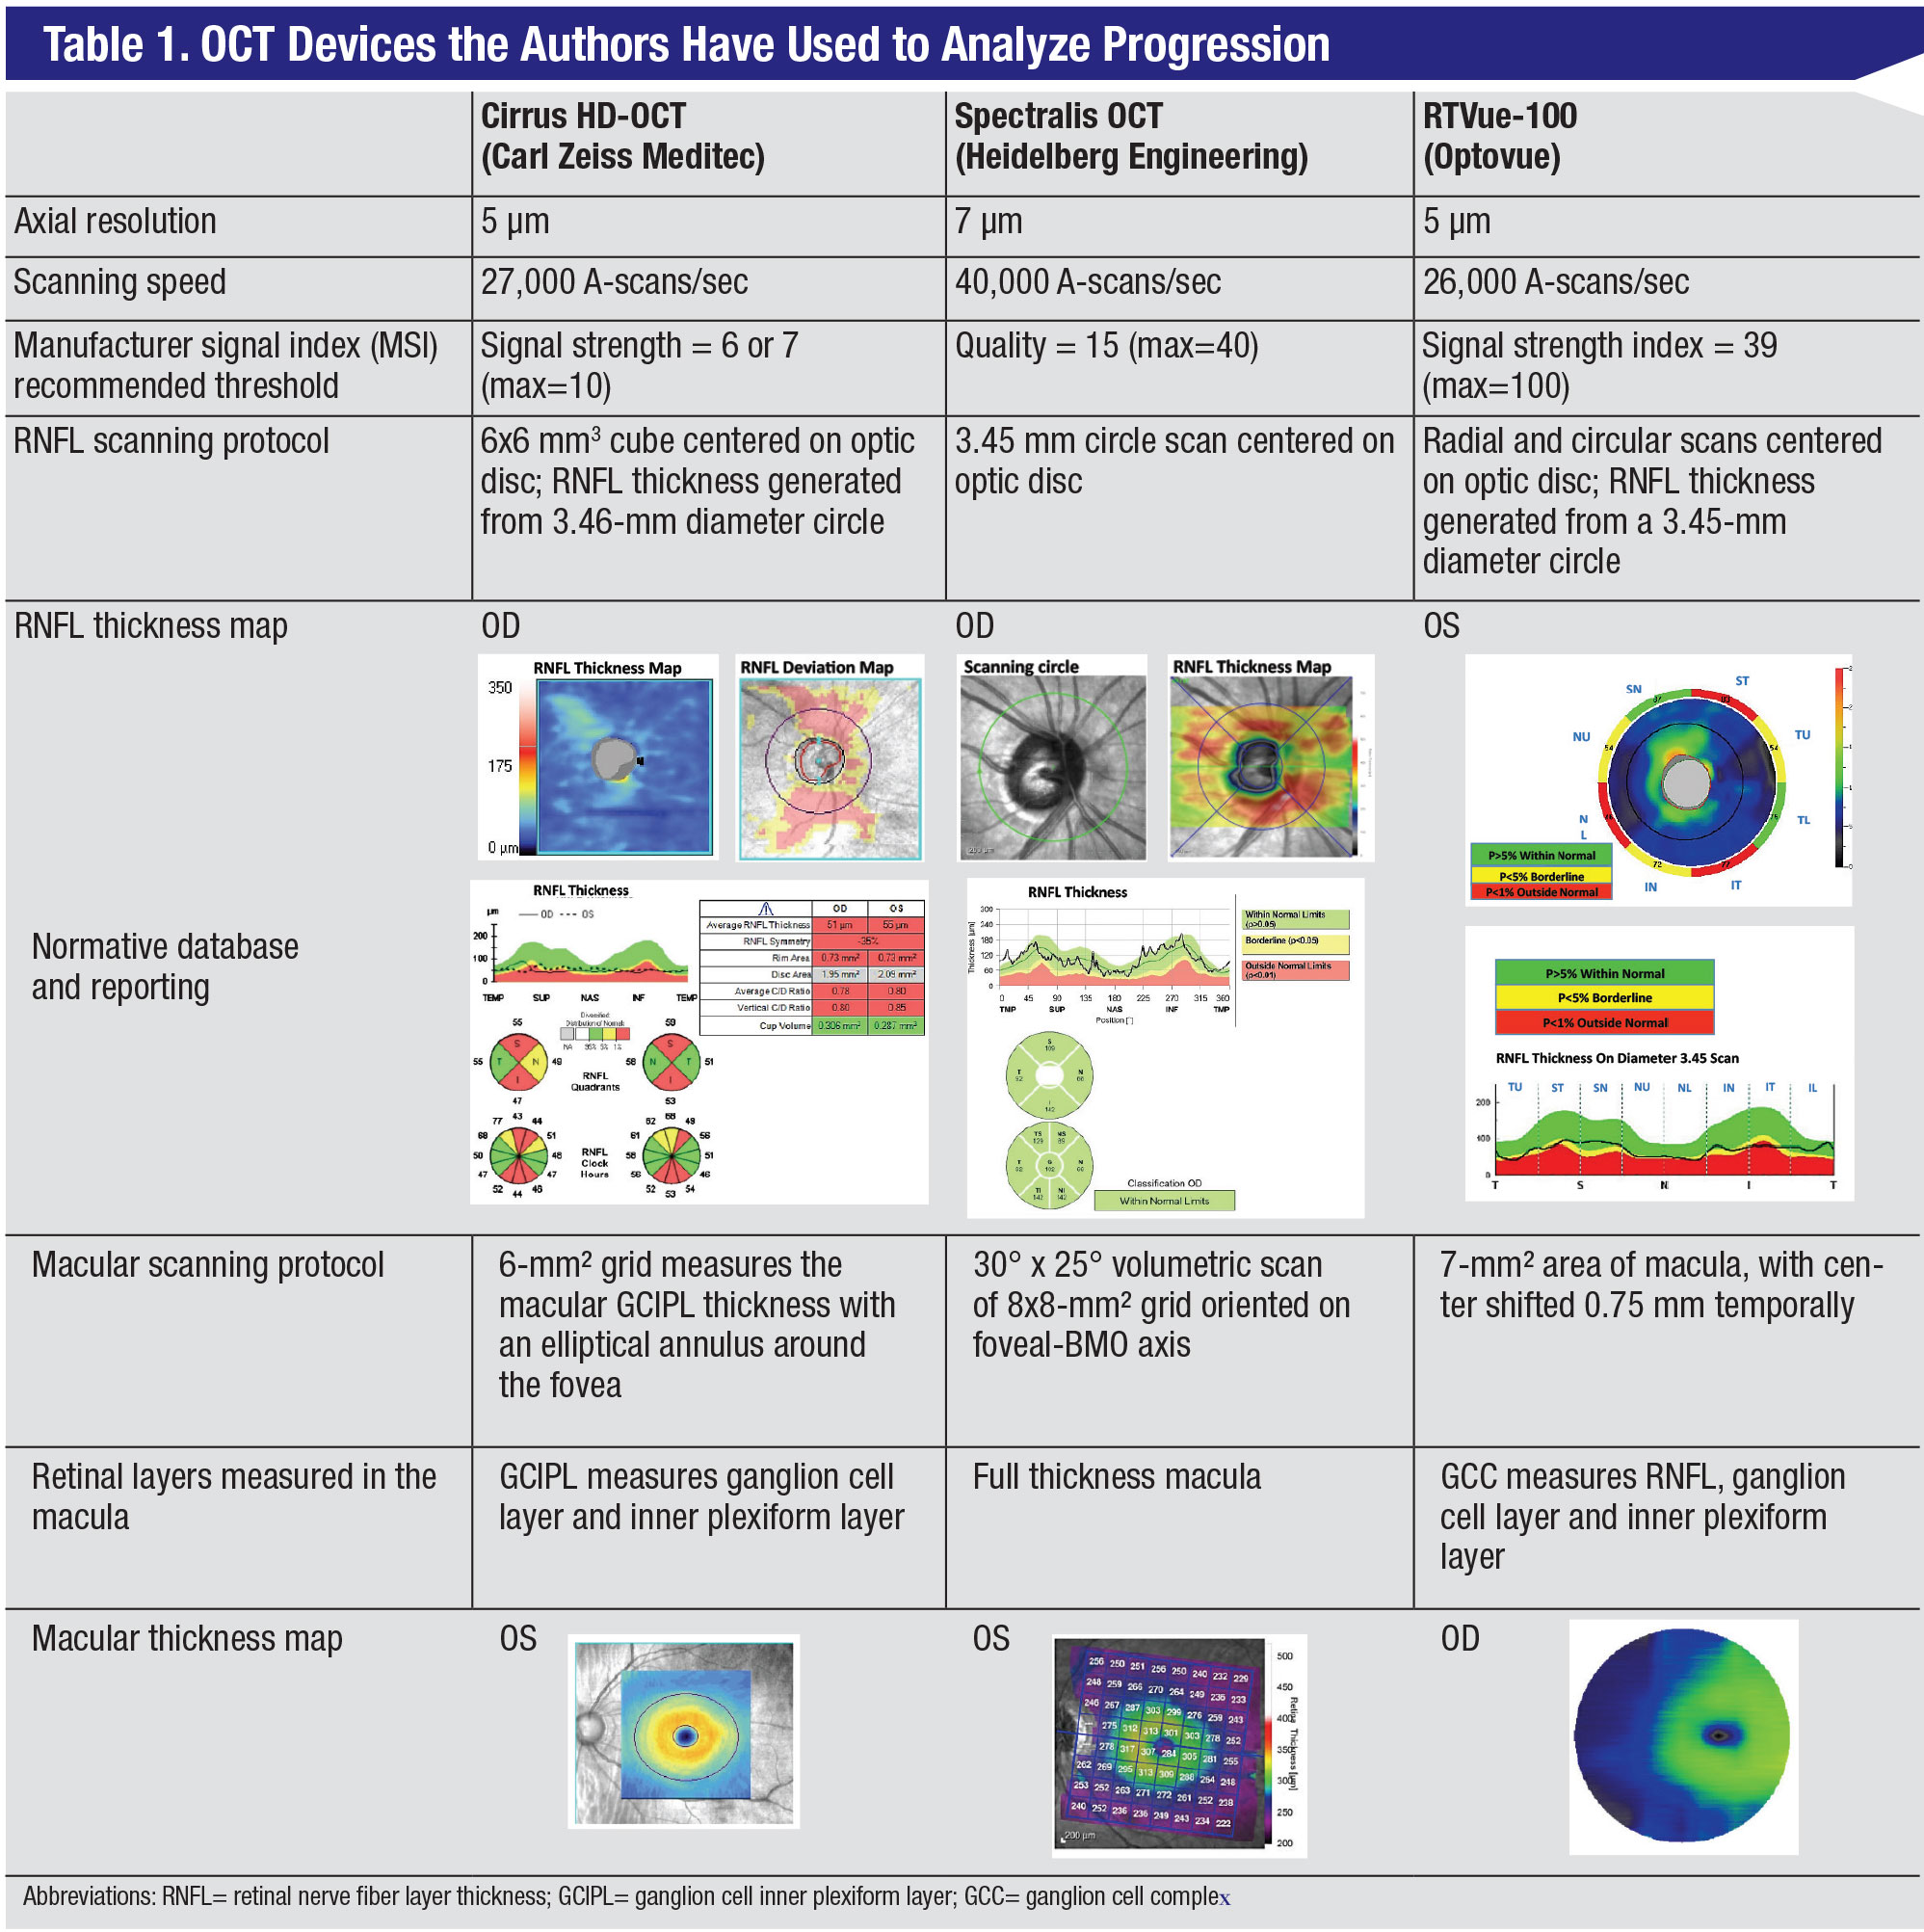
Currently, SD-OCT is the OCT device most commonly used in clinical practice. Spectral-domain units are made by several manufacturers; the devices differ in scanning protocols and segmentation algorithms, so their measurements are not easily interchangeable. The OCT devices we work with are the Cirrus HD-OCT (Carl Zeiss Meditec; Dublin, California), Spectralis (Heidelberg Engineering; Heidelberg, Germany), and RTVue-100 (Optovue; Fremont, California); we’ll refer to them throughout the article. Some of their specifications and differences are summarized in Table 1 (pg. 52). In addition to SD-OCT devices, swept-source OCT, such as the DRI Triton (Topcon Corporation, Tokyo, Japan), is commercially available. This device images the peripapillary RNFL and inner retinal thickness in the macula in one wide-angle scan. While this type of scan may offer an advantage over SD-OCT in detecting glaucoma progression, its clinical utility has yet to be proven in large, prospective studies. Another swept-source OCT device, the Plex Elite 9000 from Zeiss, is available, but primarily for research purposes, as opposed to common clinical practice for glaucoma.
As was mentioned earlier, in terms of commonly used devices, there are some differences to be aware of. For example, it’s been shown that RTVue gives a thicker peripapillary retinal nerve fiber layer thickness reading in comparison to the other two.4 This could lead to misdiagnosis of glaucoma progression if a patient was imaged initially on an RTVue device but subsequently imaged with any other device. On the other hand, each device has developed its own normative database, which aids in interpretation of scans. Therefore, it’s important to be aware of device differences when assessing for progression.
Each of the three SD-OCT devices we’ve worked with has its own benefits and drawbacks. For instance, while the Spectralis OCT has an eye tracking feature, the scanning time may be longer than some of the other devices’ times. On the other hand, the Cirrus OCT and the RTVue OCT don’t directly measure the retinal nerve fiber layer, but interpolate the thickness values from volume scans. There are also slight differences in axial resolution. Despite all this, the three devices have been reported to have equivalent performance. The decision on which device to obtain for your practice may be based on other factors, such as being shared with retina specialists, who prefer the Spectralis OCT, or if it’s to be used in a high-volume clinic, for which the Cirrus OCT might be better-suited due to its shorter scanning time when generating RNFL measurements.
 |
RNFL Thickness
Retinal nerve fiber layer thickness represents the ganglion cell axons before they enter the optic nerve. Loss of retinal nerve fiber layer can be observed in red-free photos and is quantified with OCT. The peripapillary RNFL thickness is by far the most popular OCT parameter used for glaucoma diagnosis and monitoring progression.
• Scanning protocol and glaucoma diagnosis. The various devices measure RNFL thickness in slightly different ways. In the Spectralis OCT, it’s measured directly with a 3.46-mm diameter circular scan centered on the optic disc. In the case of the Cirrus OCT, the measurement of RNFL is generated from a 6 mm3 cube scan centered on the optic disc. The RTVue device scans the optic nerve head with multiple radial and circular scans and generates the RNFL thickness map along a 3.45-mm diameter circle centered on the optic disc.
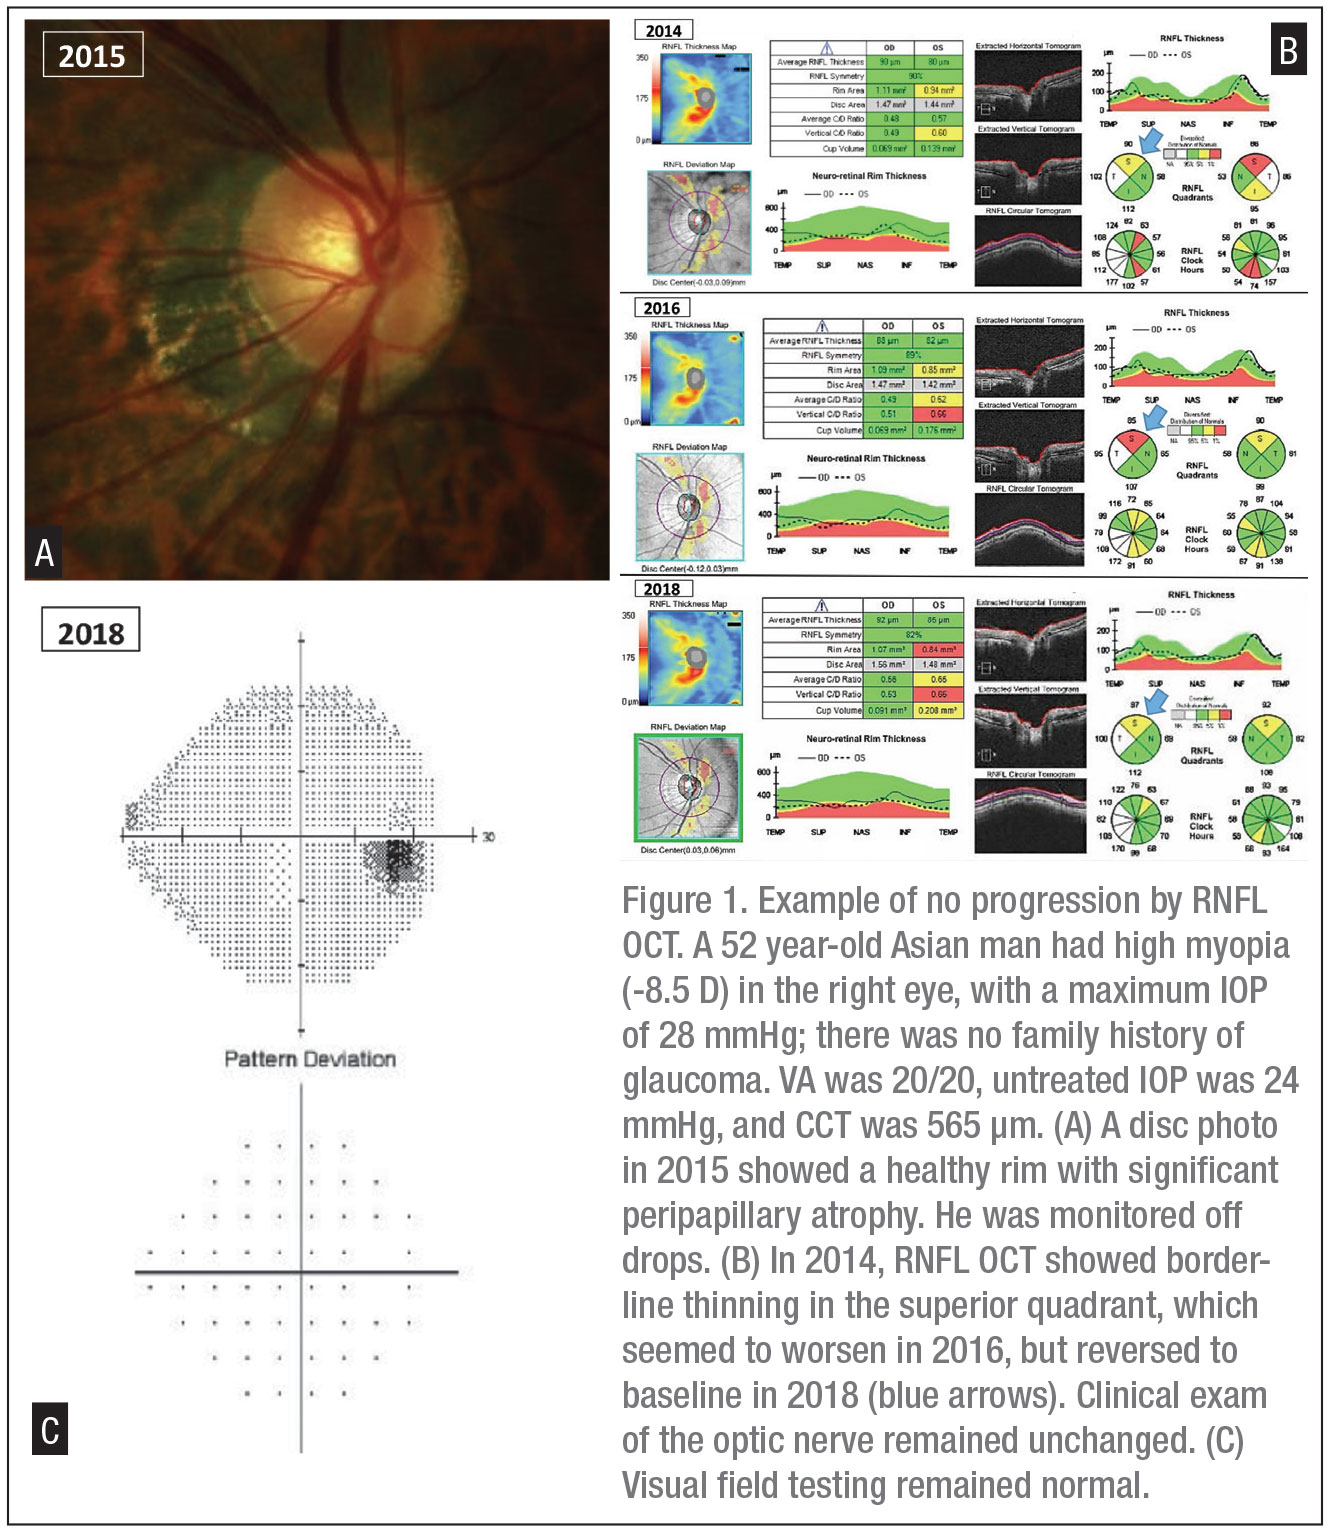
Each of the OCT devices provides the RNFL thickness curve on an age-adjusted normative database where green is considered normal, yellow is borderline and red is abnormal (RNFL values below the 99th percentile of normal database). Average RNFL thickness and the RNFL thickness in the inferior quadrant have been reported to be the most clinically relevant RNFL parameters for diagnosis, as well as progression.5 RNFL thinning may be valuable in early diagnosis of glaucoma, as it may precede visual field loss. Even if the thickness curve remains in the green area, in certain cases we should still monitor for progressive thinning. This can lead to an early diagnosis of glaucoma, known as “green disease.” Bascom Palmer’s Mohamed Sayed, MD, and his fellow researchers demonstrated asymmetric thinning of RNFL in both eyes of glaucoma patients where all RNFL measurements were within the normal range for that age.5,6 A difference greater than 9 µm in average RNFL thickness between the two eyes should alert the physician to early glaucomatous damage.7 On the other hand, myopia can lead to abnormal thinning of RNFL measured on OCT with no progression of the thinned-out areas, known as “red disease,” which isn’t glaucoma (Figure 1). (Additional details on other artifacts are provided in a section below.)
• Progression and structure-function correlations. To assess for progression with RNFL thickness obtained by OCT, we need to be aware of a few factors: thinning due to normal aging; the floor effect of this parameter; thinning suggestive of glaucoma progression, both globally and within a sector; and correlation of RNFL loss with visual field loss.
RNFL undergoes attrition with age in healthy eyes at a mean rate of -0.48 µm/year in Cirrus and -0.60 µm/year in Spectralis images. Glaucoma progression, on the other hand, has a faster rate of RNFL thinning, ranging from -0.98 µm/year for the Cirrus to -2.12 µm/year for the Spectralis. As glaucoma advances, RNFL measurement continues to decrease but it doesn’t go to zero, which is known as the “floor effect.” This is because the architectural support made up by Müller cells, astroglia, microglia and blood vessels doesn’t degenerate completely with retinal ganglion cell axons. Average RNFL floor values range from 49.2 µm for the Spectralis, to 57 µm for the Cirrus (See Table 1, pg. 52), to 64.7 µm for the RTVue. Once the RNFL thickness reaches the floor, progression can still occur, but it can’t be detected by RNFL OCT. For that reason, the clinician should consider the use of macular OCT (discussed below) and HVF 10-2 to monitor progression in advanced glaucoma.
Progression analysis is provided by each OCT device; the method for analysis can be event- or trend-based.
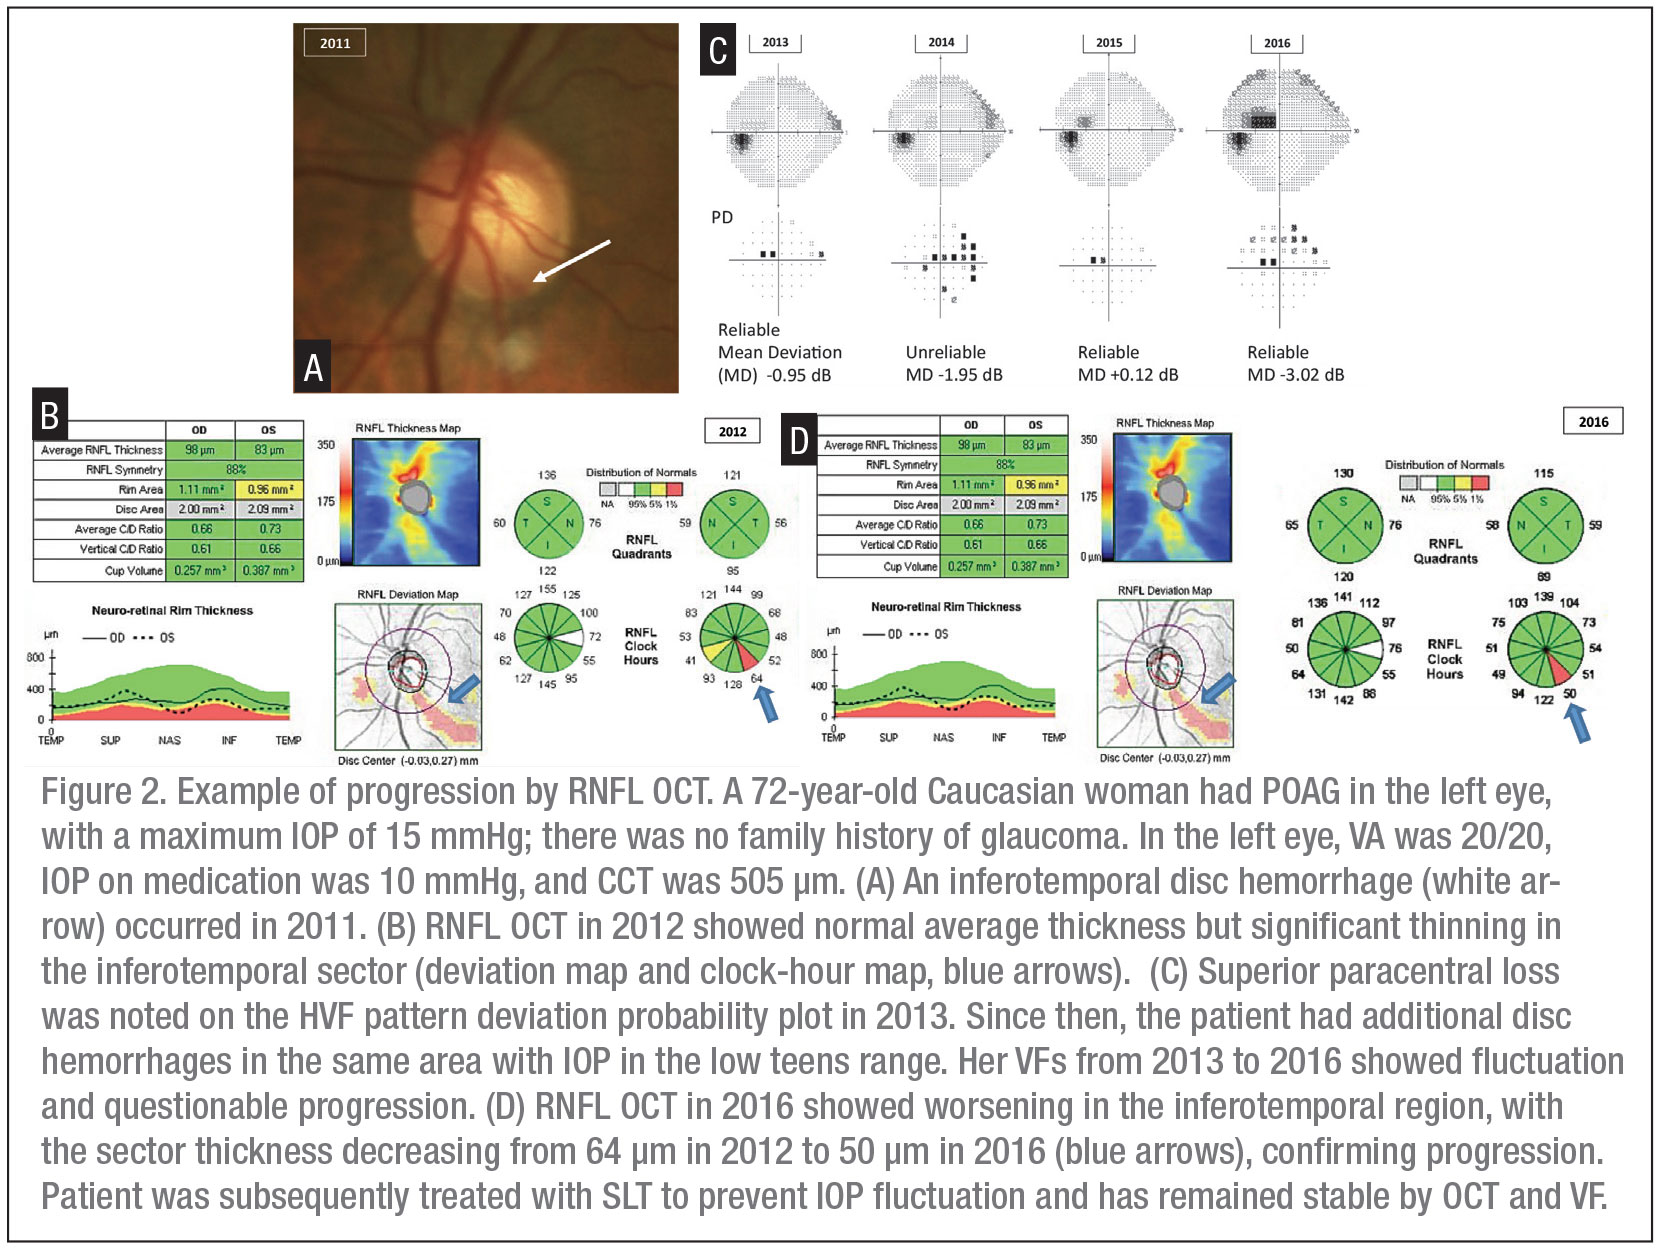
Event-based analysis measures the difference between baseline and a follow-up measurement. A decrease of 5 µm or more in average RNFL thickness is suspicious for glaucomatous progression, while a decrease of 7 to 8 µm or more in a sector of RNFL thickness also suggests progression (Figure 2).
Trend-based analysis identifies progression by monitoring the slope of RNFL thickness over time. Cirrus provides a glaucoma progression algorithm based on both event and trend, comparing RNFL thickness of individual pixels between baseline and follow-up images. Pixels are coded yellow if there is test-retest variability between a follow-up and baseline image while a red color indicates the same change evident on three consecutive scans. In Spectralis, the system looks for specific patterns in retinal structures to automatically position the retest scan in the same location; RNFL thickness change and trend reports are plotted over time to compare the rate of change. RTVue offers a trend-based analysis, which includes side-by-side global RNFL thicknesses, six sectorial thickness analysis and a regression line to determine the slope and standard error. Although progression analysis software can be a great tool, especially in a busy clinic, we should always review the original scans and the sectors, as subtle changes in a small area can be easily missed (Figure 2).
Similar to the diagnosis of glaucoma, glaucoma progression detected on OCT should be assessed in the context of the clinical exam and visual field testing, although there is significant variability in structure-function correlation at different stages of glaucoma. Clinical trials indicate that, at an individual level, structural abnormality may precede functional abnormality in some, while the reverse is true in others. A broken-stick model has been used by glaucoma specialists to explain the non-linear structural functional relationship. A practical way to apply the broken-stick model is to rely on RNFL thickness to monitor progression in pre-perimetric and early-stage glaucoma with average RNFL thickness >83 µm, visual field mean deviation (MD) >-2.5 dB and visual field index (VFI) >93 percent and to rely mostly on VF in advanced glaucoma with average RNFL thickness <55 µm and visual field MD <-10 dB.8,9 For mild to moderate glaucoma, we should use both OCT and VF measurements to monitor progression.
• Artifacts. While OCT is helpful for monitoring the progression of glaucoma, we need to be aware of artifacts, which can lead to misinterpretation.
One type of artifact that can significantly affect RNFL measurement is segmentation error, in which the imaging software incorrectly identifies the anterior and posterior RNFL boundaries or delineates the RNFL layer incompletely. Per one study (though it was only in one device), this artifact is present in 11.46 percent of RNFL scans.10 In addition, pathologic changes in the eye can affect RNFL measurements. Media opacities in the form of corneal haze, cataracts and vitreous debris may lead to a false decrease in RNFL thickness, while myelinated RNFL, epiretinal membrane, swelling of ONH and peripapillary retina can falsely increase RNFL measurements.
Another common artifact is decentration, which was reported in 27.8 percent of Spectralis scans.10 If the scan isn’t centered on the optic nerve head, RNFL appears thinner in some sectors and thicker in others. This and other artifacts may be more common in myopic eyes, which are elongated and often have peripapillary atrophy (Figure 1). Hence, it’s important for the clinician to review the actual scans along with the signal strength (Table 1), before assessing for progression based on sectors or relying on progression analysis software. Fortunately, artifacts in OCT devices have decreased over time with improvements in technology.
 |
The Macular Scan
Approximately half of the retinal ganglion cells reside in the macular region. Glaucoma can cause thinning of the macula early in the disease, especially the inferior macula, from which the retinal ganglion cells project to the inferotemporal region of the disc. Previous histology studies have shown that thinning of the macula, due to selective loss of retinal ganglion cells, occurs in glaucoma. Research has found that imaging the retinal thickness loss in the macula is a sensitive measure for detecting early glaucoma.11
• Diagnosis and scanning protocol for macular OCT. Each of the three OCT devices provides a different scan of the macula (Examples appear in Table 1). Cirrus uses Ganglion Cell Analysis (GCA) to measure the thickness of the ganglion cell inner plexiform layer (GCIPL, ganglion cell layer + inner plexiform layer); the GCIPL and inferior GCIPL have the best diagnostic value for glaucoma. Spectralis performs a volume scan of macula, presents the thickness in an 8 x 8 mm grid oriented on the fovea-to-disc axis and provides asymmetry analysis between the two eyes, which has shown utility in glaucoma diagnosis.12 RTVue measures the GCC in a scan not centered on the fovea but shifted to include more of the temporal macula. In patients with focal thinning of the peripapillary RNFL, macular scans have diagnostic capability similar to RNFL thickness for detecting glaucomatous damage and aiding in the diagnosis of glaucoma.13
In contrast to the optic nerve and peripapillary area, where blood vessels are abundant, the macula is relatively devoid of large vessels. Similarly, disc size can be variable, while the macular region is comparatively uniform among patients. Hence, in individuals with large areas of peripapillary atrophy or high myopia, macular inner retinal layer is less affected than RNFL. In myopic patients, asymmetry between superior and inferior GCIPL thickness can occur in early glaucoma, and a difference of 5 µm is considered suspicious for glaucoma. Efforts are underway to develop normative databases for myopic individuals in order to improve the diagnostic capability of macular OCT.
• Progression monitoring with macular OCT. Average GCIPL thickness in normal subjects has been reported to be 82.1 ±6.2 µm, with the superonasal sector being the thickest and the inferior sector the thinnest.14 Like the RNFL, macular GCIPL also undergoes attrition with aging at a rate of about -0.31 µm/year.15 In addition to age, other factors that may influence macular retinal thickness are gender, central corneal thickness, axial length and RNFL thickness.
Average GCIPL thickness is about 75.2 ±6.8 µm in early glaucoma; it thins to 64.4 ±8.4 µm in moderate glaucoma and to 55.6 ±7.6 µm in advanced glaucoma.16 An average GCIPL thickness change of more than 4 µm is suggestive of glaucomatous progression. In glaucoma progression, macular thickness change is visible as an arcuate defect on the thickness and progression-change maps. Macular parameters can also be affected by the floor effect, although this occurs later in the disease than is seen in the RNFL. In fact, studies have shown that in advanced glaucoma, when RNFL thickness is below 55 µm, change in GCIPL thickness can still correlate with functional damage measured by 10-2 VF. The floor effect in macular GCIPL measurements is observed at an average thickness of about 45 µm.
Macular GCIPL thickness has shown significant correlation with function, when VF loss is measured with 10-2 rather than 24-2 on Humphrey Standard Automated Perimetry (SAP). This is particularly true for average GCIPL and the inferior sector. In addition, built-in software can help clinicians monitor progression in macular OCT. Cirrus-HD OCT has Guided Progression Analysis, which is based on both event and trend. This analysis requires a minimum of four high-quality macular scans (two baseline and two follow-up). If a decrease in thickness is observed in the first follow-up scan the pixel is coded as yellow. If detected subsequently, the pixel is coded as red. The RTVue OCT provides the GCC map with additional parameters such as GLV (global loss volume) and FLV (focal loss volume), which can detect structural progression in early glaucoma.
Artifacts can also occur with macular OCT scans, similar to RNFL OCT. One common artifact is segmentation errors. In case of GCIPL, these may appear as segments of blue on the thickness map in the shape of a wheel, sometimes referred to as the propeller sign. Another common artifact is decentration of the scan, which may lead to the macula being incorrectly measured as too thick or too thin. Any measurement below 40 µm should alert the clinician to an artifact. In a patient with significant retinal pathology, such as macular degeneration, cystoid macular edema or epiretinal membrane, macular thickness shouldn’t be used to monitor glaucoma. Thus, a detailed examination of the macula is necessary to rule out such pathology.
 |
RNFL + Macular Scans
While macular scans have shown clinical utility in detecting early glaucoma, RNFL thickness changes are more readily detected due to the faster rate of RNFL loss in glaucoma progression. You should also be aware that “fluctuation” in thickness values can occur from scan to scan, and be sure to review a series of OCT images before confirming progression (Figure 1).
In advanced glaucoma, when RNFL reaches the floor (Table 1, Cirrus RNFL OCT example), macular OCT may be more useful. This can also apply to patients with myopia, who have variability in disc morphology and peripapillary atrophy. In both situations, we need to make sure that there’s no other pathology affecting the macula before relying on it for monitoring progression. Newer OCT devices, such as swept-source OCTs, can combine macular and RNFL analysis, although the clinical utility for that hasn’t been fully demonstrated.
 |
The Optic Nerve Head Scan
Disc parameters measured by OCT haven’t been widely accepted, probably due to variability of disc size, tilt, torsion, peripapillary atrophy and other potential artifacts. Cirrus and RTVue use an arbitrary reference plane; Spectralis, on the other hand, measures ONH with the minimum rim width at Bruch’s membrane opening (BMO-MRW), which doesn’t depend on an arbitrary reference plane. BMO-MRW measures the minimal thickness of the neuroretinal rim at the termination of Bruch’s membrane. In addition, the Glaucoma Module Premium Edition in Spectralis positions the scans according to foveal-BMO axis to minimize variability of disc position. Mean and inferotemporal BMO-MRW have a diagnostic capability comparable to RNFL and macular OCT. The utility of BMO-MRW to monitor for progression is yet to be established in large studies.
Another point to note is that current OCT technology can’t image disc hemorrhage, which has been established as a clinical sign of glaucoma progression. Focal thinning of the RNFL measured by OCT and loss of visual field sensitivity—often in the paracentral region—follow the occurrence of a DH within one to two years (Figure 2). Therefore, it’s important to perform a detailed exam of the optic disc at every visit.
In conclusion, monitoring progression is an essential part of glaucoma care, and OCT has proven to be a quantitative and reliable tool for monitoring. However, it should be used in conjunction with clinical evaluation and visual field testing. Furthermore, different stages of glaucoma may require different monitoring tools. In early glaucoma, OCT of the RNFL and macula may be important for patients with normal or unreliable visual field tests. In moderate glaucoma, the correlation between OCT measurements and VF tests helps to confirm progression. In advanced glaucoma, we need to be aware of the floor effect in RNFL OCT measurements and consider the use of macular OCT and 10-2 visual field tests to detect progression. It’s likely that as newer technology and better software develop, we’ll use OCT not only to monitor glaucoma but also to gain a better understanding of why glaucoma occurs and how this disease process can vary among individuals, with OCT angiography possibly ushering in this new era. For now, when monitoring glaucoma progression, we should combine our clinical evaluation—paying special attention to disc hemorrhage—with a visual field assessment and a good understanding of OCT and its limitations. REVIEW
Dr. Saini is a glaucoma research fellow at Massachusetts Eye and Ear. Dr. Shen is an assistant professor of ophthalmology at Harvard Medical School, and director of the glaucoma fellowship program at Massachusetts Eye and Ear.
Dr. Shen receives research support from Topcon. Dr. Saini has no financial interest in any product discussed.
1. Quigley HA, Green WR. The histology of human glaucoma cupping and optic nerve damage: Clinicopathologic correlation in 21 Eyes. Ophthalmology 1979;86:10:1803-1827.
2. Burgoyne CF, Downs JC, Bellezza AJ, Hart RT. Three-dimensional reconstruction of normal and early glaucoma monkey optic nerve head connective tissues. Investig Ophthalmol Vis Sci 2004;45:12:4388-4399.
3. Strouthidis NG, Grimm J, Williams GA, Cull GA, Wilson DJ, Burgoyne CF. A comparison of optic nerve head morphology viewed by spectral domain optical coherence tomography and by serial histology. Investig Ophthalmol Vis Sci 2010;51:3:1464.
4. Leite M, Rao H, Weinreb R, Zangwill L, Bowd C, Sample P, Tafreshi A, Medeiros F. Agreement among spectral-domain optical coherence tomography instruments for assessing retinal nerve fiber layer thickness. Am J Ophthalmol 2011;151:1: 85-92.
5. Kanamori A, Nakamura M, Escano MFT, et al. Evaluation of the glaucomatous damage on retinal nerve fiber layer thickness measured by optical coherence tomography. Am J Ophthalmol 2003;135:4:513-520.
6. Sayed MS, Margolis M, Lee RK. Green disease in optical coherence tomography diagnosis of glaucoma. Curr Opin Ophthalmol 2017;28:2:139-153.
7. Mwanza JC, Durbin MK, Budenz DL. Interocular symmetry in peripapillary retinal nerve fiber layer thickness measured with the cirrus HD-OCT in healthy eyes. Am J Ophthalmol 2011;151:3:514-521.e1.
8. Banegas SA, Anton A, Morilla A, et al. Evaluation of the retinal NFL thickness, the mean deviation, and the visual field index in progressive glaucoma. J Glaucoma 2016;25:3:e229-e235.
9. Lavinsky F, Wu M, Schuman JS, et al. Can macula and optic nerve head parameters detect glaucoma progression in eyes with advanced circumpapillary retinal nerve fiber layer damage? Ophthalmology 2018;125:12:1907.
10. Liu Y, Simavli H, Que CJ, et al. Patient characteristics associated with artifacts in spectralis optical coherence tomography imaging of the retinal nerve fiber layer in glaucoma. Am J Ophthalmol 2015;159:3:565-76.
11. Zeimer R, Asrani S, Zou S, et al. Quantitative detection of glaucomatous damage at the posterior pole by retinal thickness mapping: A pilot study. Ophthalmology.1998;105:2:224-231.
12. Asrani S. Novel software strategy for glaucoma diagnosis. Arch Ophthalmol 2011;129:9:1205.
13. Kim MJ, Park KH, Yoo BW, et al. Comparison of macular GCIPL and peripapillary RNFL deviation maps for detection of glaucomatous eye with localized RNFL defect. Acta Ophthalmol 2015;93:1:e22-e28.
14. Mwanza JC, Durbin MK, Budenz DL, et al. Profile and predictors of normal ganglion cell-inner plexiform layer thickness measured with frequency-domain optical coherence tomography. Investig Ophthalmol Vis Sci 2011;52:11:7872-7879.
15. Lee WJ, Baek SU, Kim YK, et al. Rates of ganglion cell-inner plexiform layer thinning in normal, open-angle glaucoma and pseudoexfoliation glaucoma eyes: A trend-based analysis. Investig Ophthalmol Vis Sci 2019;60:2:599-604.
16. Xu X, Xiao H, Guo X, et al. Diagnostic ability of macular ganglion cell-inner plexiform layer thickness in glaucoma suspects. Med (United States) 2017;96:51:e9182.


