 |
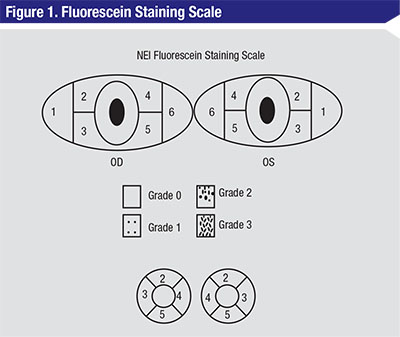
| Figure 1. The NEI scale for grading fluorescein staining divides the corneal and conjunctival surfaces to help measure fluorescein uptake.9 A standardized grading system of 0 to 3 is used for each of the five areas on each cornea. Grade 0 is specified when no staining is present, and the maximum score is 15. |
This month we’ll consider the elements of these metrics and discuss the scales we use for grading the signs of ocular disease. In a future column, we’ll explore symptom scales, questionnaires and patient-reported outcomes, all necessary tools of the trade that also need occasional sharpening. Understanding the statistical parameters and tests commonly used for assessing grading systems is an essential first step towards critically thinking about these grading scales and the responses and symptoms they measure.
The Measure of A Measure
The purpose of any scale is to provide a means to measure a trait, a physical change or any parameter not readily amenable to direct quantitation. Ultimately, we use the scores generated for comparison, as a function of age, health status or treatment regimen. All scales are not the same however, and when developing a new scale it’s necessary to test for precision, for repeatability (see the glossary) and for agreement between graders, as well as to test for agreement with existing disease metrics.
There are a number of statistical tests that measure agreement, such as the intra-class correlation coefficient. The ICC is a ratio derived from the analysis of measurement variance. The closer the ratio is to 1.0, the greater the agreement between tests.2 One statistics text suggests that an ICC of 0.4 indicates poor agreement, 0.4 to 0.75 as fair to good agreement, and greater than 0.75 as excellent agreement.3
Agreement is also presented by Bland Altman plots,4 which elegantly illustrate the difference in paired observations on the y-axis versus the mean of the observations on the x-axis, including horizontal lines for the mean difference ± two standard deviations. Bland Altman plots are a very useful snapshot of agreement between two devices, systems or graders. They originated the concept of limits of agreement between two methods. A correlation coefficient (r) is commonly and incorrectly used to measure agreement, when r actually measures the strength of relation between two variables, not the agreement between them.
There can be high concordance in using a scale because the categories are simply too broad. We could all throw a tennis ball through the width of a barn door, but what about through a window? In the case of wide confidence limits, the grading system won’t be sensitive enough to measure change, regardless of the fact that we all agreed as to each step in the scale. Thus, we want a system that is not so coarse that sensitivity is lost, and not so fine that there is no agreement among users and, consequently, no ability to have comparable data.
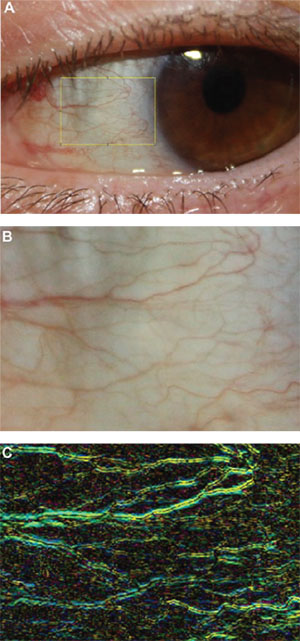 |
| Figure 2. This automated dry-eye redness software system measures hue and horizontality. |
A fine example of this was laid out in a fascinating 1991 paper on the use of scales.5 Using the example of a lens opacity grading system, the authors had two graders score 87 lenses. Instead of using the 0 to 4 scale, they broke down the scale into finer granularity, with each integer divided into nine decimals, such as 2.1, 2.2,…, 2.9, etc. With the integer scale, the concordance was 74 percent, with variance equal to ±1 grading units. To fall out of the confidence limits, there had to be a difference of two grading units between the paired observations. When the decimalized scale was used, the concordance was only 9 percent between graders, but the confidence limits were at 0.8 grading units. Thus, the decimalized scale gave confidence limits 2.5 times finer than those given by the integer scale. While practicality drives us to continue to use integer scales, incorporating 0.5 increments increases granularity and improves the sensitivity of our grading.
Ideally, we want our measurement scales to be able to identify clinical change in our patients. In practice, we need to know if a keratitis or flare reaction is worse this week than last, and we use scales to measure the progression of disease.
Change can also be associated with treatment, either in practice or in research. In a clinical trial, treatment can be either positive (comparator) or negative (vehicle, placebo). It’s particularly critical to have a sensitive measurement when dealing with a bioequivalence clinical trial of one active to a test compound. When both agents being studied in the trial have the same therapeutic effect—we must be sure differences in effect are measured sensitively and accurately to establish bioequivalence.6
The opposite can also be true, however. For the drug approval process using the conjunctival challenge model of ocular allergy, the data are highly reproducible, with tight standard deviations. This provides a level of sensitivity that is well above what occurs in seasonal allergic conjunctivitis studies. Because of this sensitivity level, the U.S. Food and Drug Administration mandates that not only statistical significance be provided by the dataset, but also that a one-unit change in integer increments demonstrates clinical significance, or an effect that would be perceptible to both the patient and the physician. In the case of dry-eye disease, one symptom and one sign are required to demonstrate efficacy by showing statistical significance in drug approval studies.7
Staining Scales
Some of scales the more commonly used to assess staining are the Baylor scale,8 the National Eye Institute grading system,9 the Oxford scale10 and the van Bijsterfeld scale.11
The NEI scale for grading of fluorescein and lissamine staining is probably the most widely used by clinicians (See Figure 1).9 While this 0 to 3 grading system is fairly simple and easy to use, it divides the cornea into regions that, with the exception of the center, do not readily reflect physiologically-relevant anatomy. The NEI scale does not consider the importance of the limbus, which contains Langerhans cells essential for active participation in a corneal inflammatory response, as well as a depository of stem cells to enrich the cornea when new cells are needed. Also, the NEI scale rates all regions of the cornea as equivalent, while our experience tells us that some areas convey more information about the underlying disease activity than others. In fact, the scales we use for grading fluorescein and lissamine green staining in clinical trials12-14 home in on these specific regions and provide a more reproducible measure of the corneal responses that appear to be the most modifiable and responsive to treatments and exacerbation with exposure.15
While we all agree that counting keratitic dots would be an inefficient way to spend our day in the clinic, we’ve developed an automated method of counting the dots in slit lamp photos using computer software, and thus have an improved, continuous, numerical scale for grading fluorescein staining. While presently this software is used only in research, it’s not unthinkable that one day a slit lamp photo will be scanned into the computer to yield an exact count while the patient waits.16
Rating Redness
Redness scales abound in the ophthalmic literature. These ideally are specific to disease, as we all know that many diseases respond with a characteristic hyperemia (a topic we have explored at length in past columns). The Ephron illustrated scales are often used, although these were developed for the grading of redness associated with contact lens wear. Interpretation is provided for the Efron scales as clinical action not required (0, normal), clinical action rarely required (1, trace), clinical action may be required (2, mild), clinical action usually required (3, moderate) and clinical action certainly required (4, severe).17, 18
 |
We have developed redness scales specific to allergy, dry eye (See Figure 2),19 meibomian gland dysfunction and blepharitis (See the April and May 2016 Therapeutic Topics columns). These have been calibrated with thousands of patients in clinical trials among investigators all over the United States. Again, allowing for half increments improves the granularity and sensitivity of the scale. Image analysis techniques for redness assessment have been the focus of research by us and others,19,20 and have been found to be six to 35 times more repeatable than subjective grading.21 We’ve also developed automated software designed specifically to grade dry-eye redness, which has a unique horizontal component and which is best predicted by the combined characteristics of hue intensity and vessel geometry.19 Our work confirms an earlier demonstration that edge detection and vessel area are as important as color intensity, using comparisons with the Annuziato, Efron, Brian Holden Vision Institute (formerly CCLRU) and Vistakon redness scales, all of which are based on photographic or illustrated reference images for each increment.21 Both the Brian Holden scales, published in 1993, and the Efron scales, first published in 1997,17,18 were developed with contact lens wear complications in mind. Johnson & Johnson (The Vision Care Institute) has also published photographic and pictorial scales of redness, staining and MGD, as well as pinguecula, pterygium and cortical cataract severity to aid in the management of chronic UV exposure.22 Of course, redness scales are also useful in diagnosis of bacterial conjunctivitis and glaucoma. There are even apps for iPhones that give the clinician a sliding photographic scale with 0.1 increments to use during patient visits.
Scleritis and Uveitis
Other complex clinical presentations such as scleritis also need to be managed over time. Uveitis specialists have developed standardized photographs to consistently grade the severity of scleral inflammation.23 Automating these types of scales through imaging is becoming more common, as OCT-derived measurements have been shown to have good agreement with clinical vitreous haze scores, and may be incorporated into the monitoring and retreatment regimens of patients with uveitis.24
It’s inevitable that, in the not-too-distant future, imaging techniques and new technologies will ultimately replace the qualitative grading of signs that we currently use. However, the clinician will always be needed to assess and corroborate the results of these new approaches. Until then, we must bridge these techniques with accurate and comparable grading systems that function over time and over different graders, using statistical tools to assess how well the new or old method measures up to the gold standards. Recalibrating your thinking on a periodic basis about the scales you use in ophthalmic practice will improve the quality of your observations in the clinic and help you tailor the long-term care you provide to each of your patients. REVIEW
Dr. Abelson is a clinical professor of ophthalmology at Harvard Medical School. Ms. Smith is Manager of Medical Writing at Ora. Dr. Hollander is chief medical officer at Ora, and assistant clinical professor of ophthalmology at the Jules Stein Eye Institute at the University of California, Los Angeles. Dr. Usner is president of Statistics and Data Corporation of Tempe, Ariz. Dr. Abelson may be reached at MarkAbelsonMD@gmail.com.
1. McAlinden C, Khada J, Pesudovs K. Statistical methods for conducting agreement (comparison of clinical tests) and precision (repeatability and reproducibility) studies in optometry and ophthalmology. Ophth Physiol Optic 2011;31:330-338.
2. Zaki R, Bulgiba A, Nordin N, Ismail NA. A systematic review of statistical methods used to test for reliability of medical instruments measuring continuous variables. Iran J Basic Med Sci 2013;16:803-807.
3. Rosner B. Fundamentals of Biostatistics. 6th Ed. Duxbury, Mass.: Thomson Brooks/Cole, Cengage Learning 2006.
4. Bland JM, Altman DG. Statistical methods for assessing agreement between two methods of clinical measurement. Lancet 1986;i:307-310.
5. Bailey IL, Bullimore MA, Raasch TW, Taylor HR. Clinical grading and the effects of scaling. Inv Ophthalmol Vis Sci 1991;32:2:422-432.
6. Temple R, Ellenberg SS. Placebo-controlled trials and active-control trials in the evaluation of new treatments. Part 1: Ethical and Scientific Issues. Ann Int Med 2000;133:6:455-463.
7. Ousler GW, Gomes PJ, Welch D, Abelson MB. Methodologies for the study of ocular surface disease. Ocul Surf 2005;3:3:143-154.
8. DePaiva CS, Pflugfelder SC. Corneal epitheliopathy of dry eye hyperesthesia to mechanical air jet stimulation. Am J Ophthalmol 2004;137:109-115.
9. Lemp MP. Report of the National Eye Institute: Industry workshop on clinical trials. CLAO J 1995;21:221-232.
10. Bron AJ, Evans VE, Smith JA. Grading of corneal and conjunctival staining in the context of other dry eye tests. Cornea 2003;22:7:640-650.
11. van Bijsterveld OP. Diagnostic tests in the Sicca Syndrome. Arch Ophthalmol 1969;82:10-14.
12. Meerovitch K, Torkildsen G, Lonsdale J et al. Safety and efficacy of MIM-D3 ophthalmic solutions in a randomized, placebo-controlled Phase II clinical trial in patients with dry eye. Clin Ophthalmol 2013;7:1275-1285.
13. Semba CP, Torkildsen GL, Lonsdale JD, et al. A Phase II randomized, double-masked, placebo-controlled study of a novel integrin antagonist (SAR 1118) for the treatment of dry eye. Am J Ophthalmol 2012;153:6:1050-1060.
14. Shappard JD, Torkildsen GL, Lonsdale JD, et al. Lifitegrast ophthalmic solution 5.0% for treatment of dry eye disease. Results of the OPUS-1 Phase III study. Ophthalmology 2014;121:475-483.
15. Fenner BJ, Tong L. Corneal staining characteristics in limited zones compared with whole cornea documentation for the detection of dry eye subtypes. Invest Ophthalmol Vis Sci 2013;54:8013-8019.
16. Rodriguez JD, Lane KJ, Ousler GW, Angjeli E, Smith LM, Abelson MB. Automated grading system for evaluation of superficial punctate keratitis associated with dry eye. Invest Ophthalmol Vis Sci 2015;56:4:2340-7.
17. Efron N, Morgan PB, Katsara SS. Validation of grading scales for contact lens complications. Ophthalmic Physiol Opt 2001;21:17-29.
18. Efron N. Grading scales for contact lens complications. Ophthalmic Physiol Opt 1998;18:182-186.
19. Rodriguez JD, Johnston PR, Ousler GW, Smith LM, Abelson MB. Automated grading system for evaluation of ocular redness associated with dry eye. Clin Ophthalmol 2013;7:1197-1204.
20. Amparo F, Wang H, Emami-Naeini P, Karimian P, Dana R. The Ocular Redness Index: A novel automated method for measuring ocular injection. Invest Ophthalmol Vis Sci 2013;54:7:4821-6.
21. Wolffsohn JS. Incremental nature of anterior eye grading scales determined by objective image analysis. Br J Ophthalmol 2004;l88:1434-1438.
22. The Vision Care Institute. http://www.thevisioncareinstitute.ae/sites/default/files/content/ae/pdf/3424%20UV%20Grading%20Scale%20A4_v6.pdf accessed 22 June 2016.
23. Nida Sen H, Sangave AA, Goldstein DA, et al. A standardized grading system for scleritis. Ophthalmology 2011;118:4:768.
24. Keane PA, Karampelas M, Sim DA, et al. Objective measurement of vitreous inflammation using optical coherence tomography. Ophthalmology 2014;121:9:1706-1714.


