Today, surgeons managing glaucoma rely largely on optical coherence tomography (which measures ocular structure) and visual fields (which assess function) to detect disease and monitor progression. However, disagreement between them is a frequent occurrence. That raises the question of what to do when a disagreement arises.
Disagreement between OCT and visual field data can happen for a number of reasons, ranging from the nonlinear relationship between changes in structure and function as glaucoma progresses, to artifacts in measurements, to nonglaucomatous pathologies and anomalous optic discs. Here, surgeons with expertise in this area discuss some of the reasons OCT and visual field data may disagree when assessing glaucoma, and what you can do when it happens.
Structure Vs. Function
“Disagreement between structure and function measurements in glaucoma is very common,” notes David S. Greenfield, MD, a professor and Douglas R. Anderson Chair in Ophthalmology, vice-chair for academic affairs and co-director of the Glaucoma Service at the Bascom Palmer Eye Institute, University of Miami Miller School of Medicine. “Our group analyzed data from 147 glaucomatous eyes that were followed annually for six years with serial visual field testing and OCT measurements of the retinal nerve fiber layer and macula.1 Only 7 percent of these eyes showed consistent progression in all three parameters.”
Certainly one of the most common reasons for a disagreement between OCT and visual fields is the best-known one: Measurable changes in structure don’t always parallel measurable changes in function. “As biological changes associated with glaucoma progression occur, ganglion cell axons die and eventually become atrophic,” notes Dr. Greenfield. “Longitudinal changes in retinal nerve fiber layer and macular ganglion cell thickness should [in theory] agree with serial changes in visual function using standard automated perimetry, yet many patients with glaucoma progression develop isolated changes in structural tests without detectable changes in visual function, and vice versa.”
“There are definitely times when one measurement shows signs of worsening while the other seems stable,” agrees Philip P. Chen, MD, a professor and Grace Hill Chair in the department of ophthalmology at the University of Washington and chief of ophthalmology at the UW Medicine Eye Institute. “For example, in early glaucoma the visual field often continues to look fine, but OCT may indicate that structural change is taking place. Harry Quigley’s lab showed many years ago that it took a 20-percent loss of ganglion cells to produce a 5-dB loss detectable on automated perimetry.2
“If the OCT suggests structural change in early disease,” he adds, “I’d get a confirmatory OCT and then explain to the patient that although we can’t detect any symptoms yet, starting to treat is the smart thing to do.”
Joel S. Schuman, MD, FACS, director of the NYU Langone Eye Center, and Elaine Langone Professor and chairman of ophthalmology and professor of neuroscience and physiology at NYU Langone Health, NYU Grossman School of Medicine, points out that the same disconnect applies when disease is advanced, although in the opposite direction. “If a more advanced glaucoma patient has a very thin nerve fiber layer, let’s say below 55 µm, you’ll typically have both an abnormal visual field and abnormal OCT,” he says. “However, if you’re following for progression, the mean OCT nerve fiber layer thickness may not be changing, even though the patient is actually getting worse. That’s because of the OCT floor effect. Meanwhile, the visual field can still show progression because it has more dynamic range remaining at the low end.”
“The OCT RNFL measurement may lose its usefulness sooner than visual field testing does,” agrees Dr. Chen. “Because of glial scar tissue or other nonfunctional structural tissue in the retinal nerve fiber layer, the measurable thinning stops—even though damage is continuing. As a result, OCT RNFL thickness may reach a measurement floor, while areas on the visual field are still followable, especially if you’re using a 10-degree test rather than a 24- or 30-degree test.”
 |
Other Reasons for Disagreement
Conflicting data can arise for other reasons as well. These can be loosely grouped into three categories: technology-related issues; ocular-structure-related issues; and pathology-related issues. They include:
• Different testing strategies. “For example, regions of retinal topography may not directly correspond to the same regions in visual field testing,” Dr. Greenfield explains.
• Poor OCT scan quality. Dr. Schuman points out that it’s essential to have good-quality testing, particularly with OCT. “If the scan quality isn’t good enough, the device won’t be able to properly segment the layers of the retina,” he says. “That’s a big cause of what Richard Lee, MD, likes to call ‘red disease.’ Improper segmentation causes a false reading of a thin nerve fiber layer, and it shows up on the report as red.”
• The visual field learning effect. “This can have a big impact,” notes Christopher A. Girkin, MD, chairman of the Department of Ophthalmology and Vision Sciences at Callahan Eye Hospital, University of Alabama. “It’s not uncommon to get a few points and even clusters that can mimic a real visual deficit and cause a structure-function disparity.”
Eyes that aren’t average can also cause misleading readings:
• Very thick or thin nerve fiber layer. Dr. Schuman notes that conflicting visual field and OCT data can happen when the nerve fiber layer is very thick or thin, even with good-quality testing. “Suppose the patient has a relatively thick nerve fiber layer, but it’s below the normal range,” he says. “Approximately 75 µm of nerve fiber layer thickness is what we call the tipping point. If the mean nerve fiber layer thickness is greater than that amount, even though an area on the OCT may show up as being abnormal—and it may really be abnormal—it’s unlikely that you’ll find an abnormality in the visual field. This can also be true over time; if you’re following a patient with a nerve fiber layer thicker than 75 µm, OCT progression analysis may detect progression as the NFL thins, while the visual field remains normal. It’s more unusual to get conflicting data when the nerve fiber layer thickness falls in the intermediate zone.”
• Variability in the optic nerve head. Dr. Girkin points out that normal variability in the optic nerve head can cause glaucomatous readings. “Larger optic nerve heads can appear abnormal on scans,” he notes. “A tilted disc, in particular, can look abnormal when it’s really just anomalous.”
He points out that the appearance of the optic nerve on visual examination can be misleading as well. “Probably the most common cause of non-artifactual pseudo-structure-function disparity—in the presence of real disease—is the glaucomatous microdisc,” he says. “In an optic nerve head with a small neural canal, even a small degree of cupping can represent significant injury that can be missed if the impact of the scleral canal size on the appearance of the nerve isn’t appreciated.”
Nonglaucomatous pathology can also cause a disagreement between OCT and visual fields:
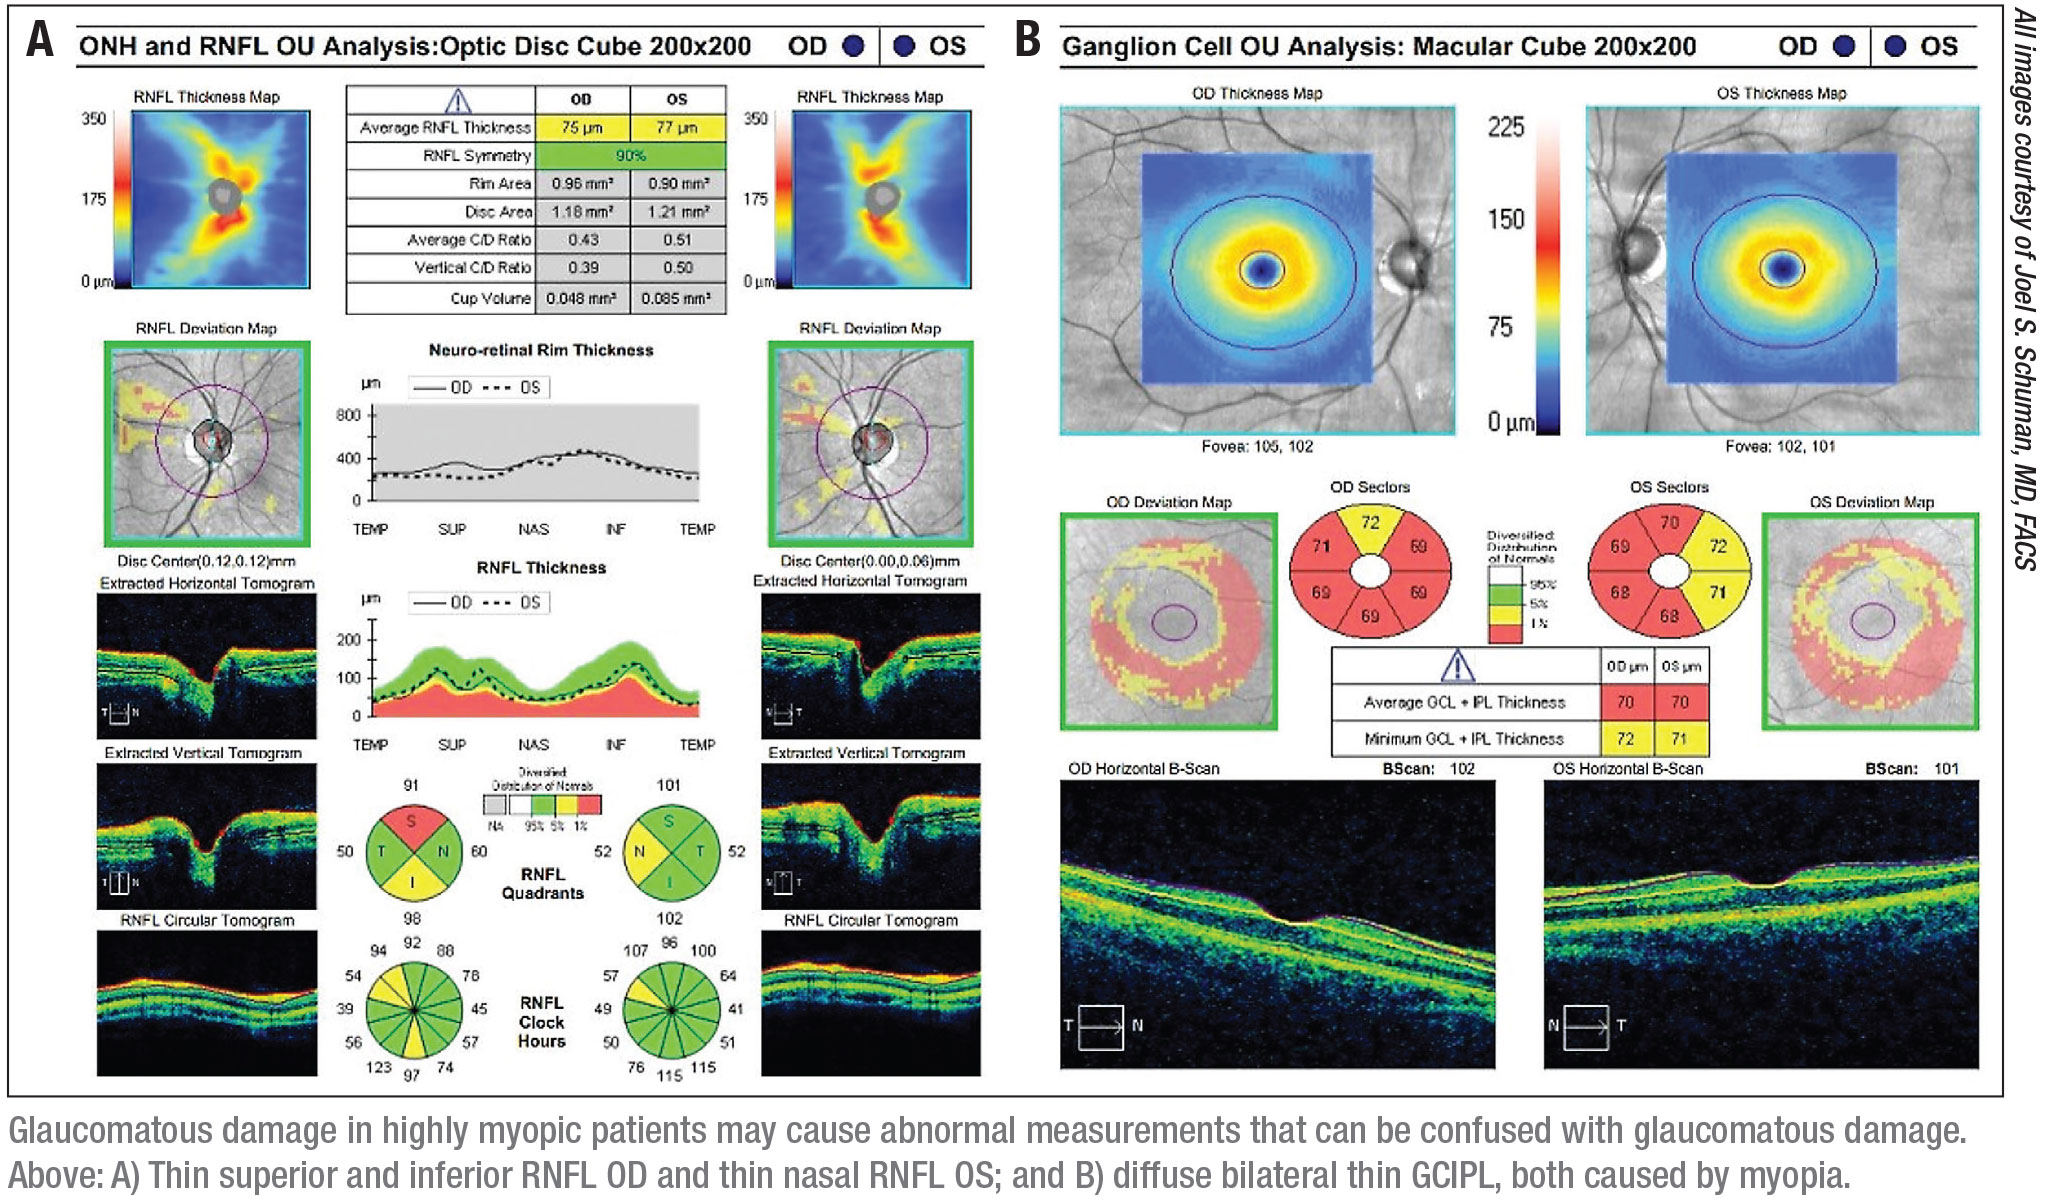
• High myopia. “In a myope—especially a high myope—the retina has to cover a lot more area than in an emmetropic eye,” Dr. Schuman explains. “That results in a thinner retina overall. As a result, someone with moderate to high myopia may have a nerve fiber layer or macular measure that’s thinner than the normal thickness range, despite the retina being normal. That abnormal measurement may be perfectly normal for them.
“Unfortunately, the normative OCT databases don’t include people with highly myopic eyes,” he explains. “In general, the people included in those databases only have up to -6 D of myopia—if that much. So a high myope may show up as abnormal on an OCT but produce a normal visual field. You may be left wondering whether or not that patient really has glaucoma.”
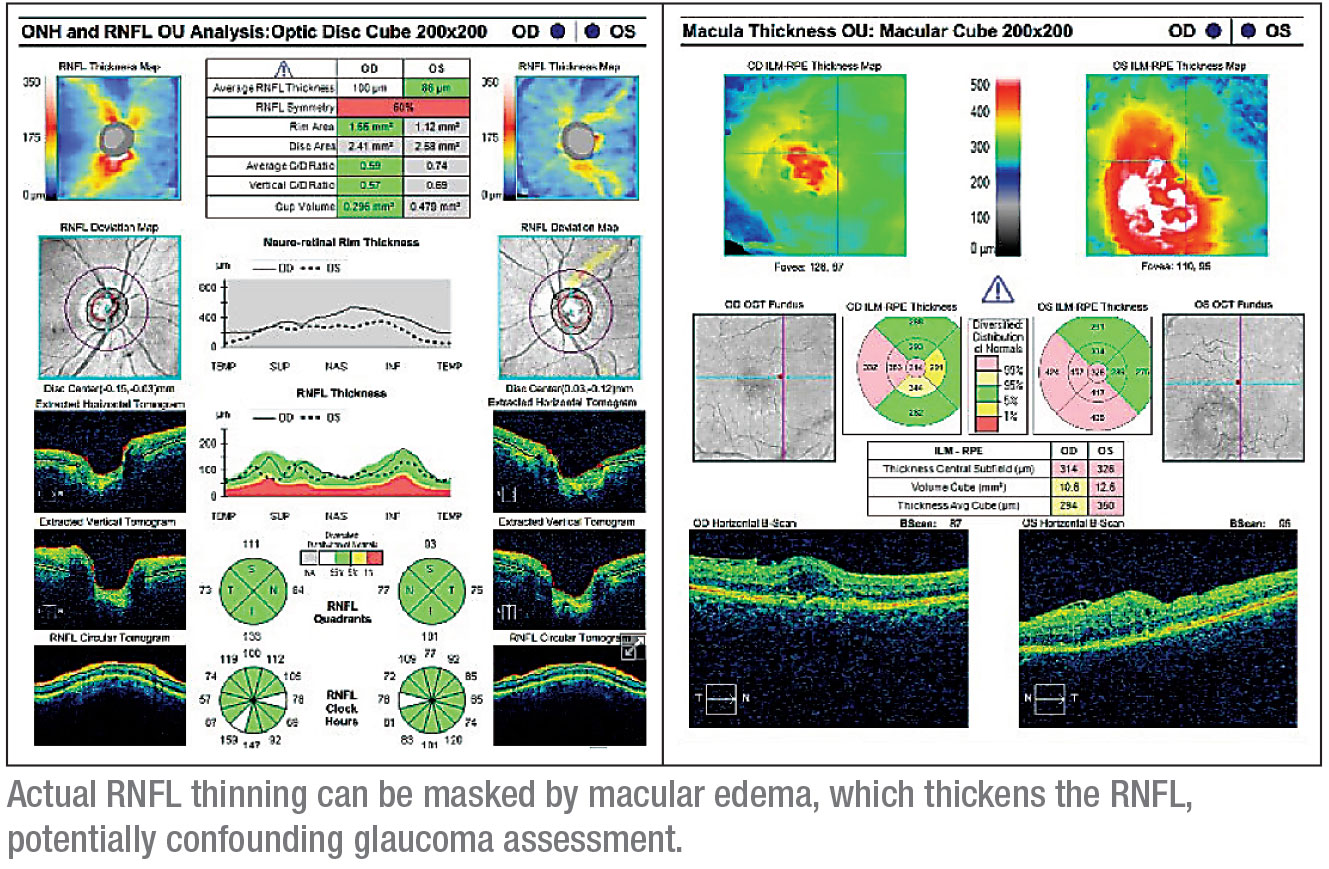
• Macular degeneration or edema. “You have to be careful about interpreting OCT measurements when the patient has macular degeneration or macular edema,” Dr. Schuman notes. “Moderate to advanced macular degeneration can cause retinal thinning. On the other hand, macular edema can make the nerve fiber layer measure thicker than it otherwise would be, so you have to be careful with that interpretation as well. Such a patient may have an abnormal visual field that reflects true thinning of the nerve fiber layer, but you can’t measure it with the OCT because the tissue has been thickened with fluid.”
• Non-glaucomatous optic neuropathy. Dr. Girkin says this is another important—and potentially life-threatening—cause of structural and functional disparity. “Compressive lesions, retrobulbar optic neuritis, ischemic optic neuropathy and other lesions that affect the visual pathways can all cause visual field defects that defy the typical structural and functional relationship seen in glaucoma,” he says.
 |
Resolving the Discrepancy
What should clinicians do when assessing discordance between structure and function? Some options involve using the technology differently to seek clarification; other options involve looking for explanations that involve the eye or nonglaucomatous pathology. In terms of using the technology differently, ophthalmologists offer these suggestions:
• Repeat the testing. “This is the first thing to do, particularly in eyes with poor-quality imaging or unreliable visual fields,” Dr. Greenfield says.
• Look at the raw OCT data. “Probably the most common cause of discrepancy between OCT and visual fields is an artifact in either the structural or functional test,” says Dr.
Girkin. “On the imaging side, edge-detection artifacts are very common, as well as artifacts associated with epiretinal membranes and other structural abnormalities unrelated to glaucoma. So, if you encounter a discrepancy between OCT and visual field, scan the visual field for artifacts. Look at the raw, cross-sectional B-scans from the OCT. That’s very important because you can’t rely on the interpreted OCT data—the color printouts. Many OCT scans have edge-detection errors, so unless you look at the raw data, you’re not going to know whether the anomaly is an artifact.”
“Poor-quality data and measurement variability will often lead to discordance between structural and functional measurements,” agrees Dr. Greenfield. “OCT measurement artifacts exist in up to 30 percent of scans; they often result from eye movement, shadowing associated with ptosis or eyelid blink, or algorithm failure.”
• Focus on the macula. “The idea of targeted structure and/or functional analysis makes a lot of sense,” says Dr. Girkin. “It’s been known for a while that macular damage can occur early and can progress, but I think that fact is appreciated a lot more today. Looking at the macula, or specific segments of the nerve that are prone to damage, is very important.”
“You can rely on the macula to show change late in the disease,” notes Dr. Chen. “The macula has large reserves of ganglion cells, so it’s one of the first areas to show damage in early disease, and it’s one of the last areas in which you can follow damage in advanced disease. It’s useful at every stage, although it may be harder to use it for this purpose in early disease, because the changes will be fairly subtle.”
As noted, macular edema can also cause misleading OCT measurements. “If there’s any doubt about whether or not edema is present,” says Dr. Schuman, “a macular scan will often reveal it.”
• Look for localized areas of change. Dr. Schuman notes that if progression is occurring, you may be able to find specific local areas changing on the OCT. “That’s especially easy with the progression analysis that’s available on the Zeiss Cirrus OCT device,” he says. “If you don’t have that option, but you’re able to look at the volumetric scan for areas of statistically significant change, you may be able to see small areas that show up as thinning.”
• Increase the visual field stimulus size. “One way to improve your ability to measure change when disease is advanced is to concentrate on 10-degree visual fields while increasing the stimulus size,” notes Dr. Chen. “A standard visual field is done with a size-III stimulus, which has a surface area of 4 mm2. But when you approach the point at which the patient can’t detect those stimuli any longer, resulting in a totally black visual field, you can switch to a size-V stimulus, which is 64 mm2. This can allow the patient to detect the stimulus again, despite advanced glaucomatous damage, giving you more useful data to follow over time.
“Of course,” he adds, “once you switch to a different stimulus, you won’t be able to compare the results to earlier tests. You’ll have to get a new baseline, but then you can follow the change over time again. Unfortunately, some test algorithms—for example, SITA-standard, -fast, and -faster—are not available with all stimulus sizes.”
• Use optic disc photos. Dr. Chen says that when pathology causes OCT scans to be unreliable he sometimes turns to optic disc photography to get a better idea about the patient’s condition. “Sometimes I still use a stereo photograph as a final arbiter,” he says. “At our academic medical center, we have ready access to stereo fundus photography. When seeing a new patient I get a baseline OCT, but at the next visit I’ll get a stereo fundus disc photo to have that baseline as well.
“One reason disc photos are often valuable is that they’re sort of an obsolescence-proof technology,” he notes. “OCT technology advances all the time; I won’t be surprised if I’m using a different OCT in five years than I’m using today. That means it’s entirely possible that my current OCT data will be unreadable by the newer machines, and that makes old-school disc photos very valuable.”
Dr. Schuman points out, however, that most ophthalmologists today rarely take disc photos. “Part of that has to do with subjective vs. objective interpretation, and part of it has to do with the difficulty of getting simultaneous stereo disc photos,” he says. “To a large extent, clinicians today rely more on OCT data. However, there’s still value in a disc photo, especially when a patient has difficulty cooperating during the physical exam. You can look at a snapshot for as long as you like, whereas if the patient’s eyes are darting around during the exam, evaluating the disc will be a challenge. I’d have a very low threshold for taking a photo in that situation.”
 |
Taking the Eye Into Account
As noted earlier, structural abnormalities and pathology can result in visual field-OCT disagreements.
• If the patient is a high myope… . Dr. Schuman says deciding whether a high myope really does have glaucoma often comes down to the doctor’s experience. “The ophthalmologist’s expert knowledge and experience play a significant role in this situation,” he says. “You need to consider all of the relevant factors, including risk factors, IOP, the appearance of the optic nerve, and so forth. The decision-making process is a little bit more difficult. Here, OCT technology is more useful for longitudinal follow-up than for the initial exam.”
When you’re doing an initial exam on a high myope, Dr. Schuman notes that the location of the thinning documented on the scan can be helpful. “If you look carefully at the optic nerve head scan, you may see more thin nerve fiber layer nasal to the major bundles of the RNFL,” he says. “That can be a clue that the thinness is the result of myopia, not glaucoma. But you have to be very careful in moderate to high myopes when deciding whether the OCT findings are real, especially when they disagree with the visual field. Sometimes, even in myopes who don’t have glaucoma, you can find an arcuate defect in the nerve fiber layer and an abnormality on the visual field that looks like glaucoma. It can be an artifact of the myopia and perhaps an abnormal insertion of the optic nerve.”
• Look for disc hemorrhages. “Clinicians should carefully examine the optic nerve for disc hemorrhages, a useful biomarker of progression,” says Dr. Greenfield. “OCT imaging can’t detect them.”
“A physical examination of the fundus can tell you things the OCT can’t—especially with regard to color,” agrees Dr. Schuman. “You can’t see a disc hemorrhage on OCT. There are OCTs like the Topcon device that give you a fundus photo in addition to the OCT, but most of the other OCTs have infrared or scanning laser ophthalmoscopic images, or they use the en face OCT as the fundus image. As a result, you can miss details, especially with regard to color, that you would see if you looked at the fundus during the physical exam. I think a visual inspection of the retina is very important.”
“You still have to rely on your clinical exam to detect hemorrhages,” says Dr. Chen. “I’m pretty compulsive about checking for them, so I’d like to think I don’t miss too many. But sometimes they’re very small and hard to detect, and patients’ pupils are not dilated at most visits. In addition, clinicians are dealing with pressure to maintain speed and efficiency in patient throughput. It’s theoretically possible to identify a hemorrhage on an infrared OCT scan, but in most cases you’d probably miss it.”
Dr. Greenfield notes that optic disc photography may be more sensitive for detecting disc hemorrhage than clinical examination. “In the Ocular Hypertension Treatment Study,” he says, “optic disc hemorrhage was a strong predictor of progression and was more frequently identified by review of optic nerve photographs (75 percent) than by clinical examination (10 percent).”3
“It’s definitely easier to identify hemorrhages on a stereo photograph,” agrees Dr. Chen. “The problem, of course, is that patients don’t get photographed at every visit. For all of these reasons, if there’s one part of the exam you really need to spend time on, it’s looking at the disc and checking for hemorrhages. Of course, if you can, review a photo at your leisure after clinic.”
• Look for paracentral defects associated with acquired pits. Dr. Girkin says this is one sign that should cause you to look closely at the central visual field. “These are very common in our tertiary referral clinic,” he notes. “Whether it’s an inferior notch, or a superior notch with a pit with some beta-zone atrophy around it, this type of lesion is generally associated with central loss.
“Targeted focused imaging of the macula in those cases is really helpful, even if the patient’s fields are full, because you might miss a central defect,” he says. “I also get a 10-2 visual field when the eye has pits, if there’s injury within the macular vulnerability zone, if there’s a defect that’s primarily paracentral on the 24-2 visual field, and in advanced cases when the patient has dense constriction.”
• Check for non-glaucomatous optic neuropathy. Dr. Girkin points out a number of things that can be used clinically to decide whether a discrepancy between OCT and visual field indicates the presence of a nonglaucomatous optic neuropathy. “Probably most important on that list are color vision and central acuity,” he says. “Glaucoma generally attacks side vision, at least as detected in conventional testing. While it can cause some macular damage, it generally doesn’t affect color vision and acuity until very late in the disease.
“On the other hand, conditions that affect the retrobulbar nerve tend to cause central damage and color vision loss very early on,” he continues. “So color vision deficit and a drop in central visual acuity can be a big clue. When there’s a disparity between OCT and visual fields in any glaucoma patient, it’s important to check color vision—although I don’t think many of us do. It’s one of the key ways to differentiate nonglaucomatous neuropathy from glaucomatous neuropathy. If there’s any question, make sure the cranial nerves are intact. Carefully evaluate for an afferent pupillary defect, and perform a complete neuro-ophthalmic assessment and history.”
Confirming OCT Data
OCT data can be challenging to interpret. Dr. Schuman offers these suggestions:
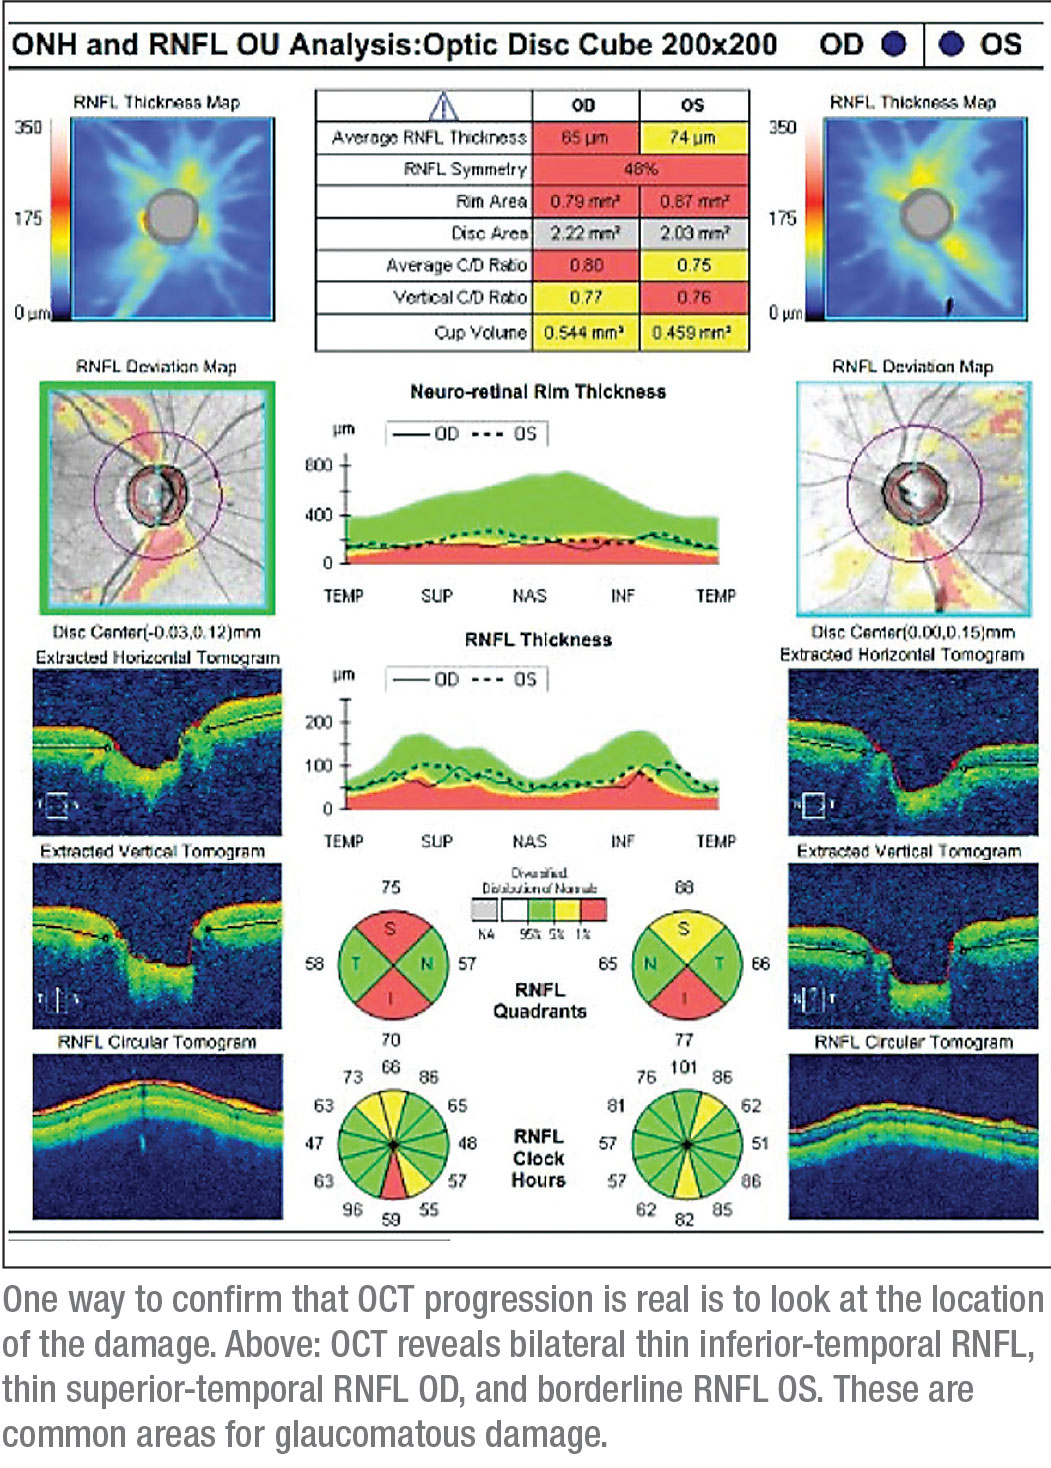
“There are a couple of things to look at that would convince me that what I’m seeing in an OCT scan is real,” he says. “One is the location of the progression. Is the thinning located in an area such as the superior or inferior temporal part of the nerve fiber layer where it exits the optic nerve, an area I would expect to be getting thinner in glaucoma? If so, that suggests the thinning is real. If your device can give you a volumetric scan, the shape of the thinning area can be another clue. If it’s expanding out from the optic nerve head toward the macula in an arcuate pattern, that also suggests that the thinning is real.
“A third way to look for supporting evidence that a change is real is to do a macular scan in addition to the optic nerve head scan,” he continues. “You should see thinning in the macula that corresponds to the thinning in the nerve fiber layer. Actually, I always scan both the optic nerve head and the macula, partly as a way to make sure my findings are real. Of course, you won’t get reimbursed for doing two scans; one of them has to be gratis. But I think the information I’m able to get, and the increase in certainty with which I’m able to make a decision, makes it more than worthwhile.
“A fourth strategy is to look for enlargement of the cup-disc ratio,” he says. “If that cupping enlargement is occurring in the setting of thinning nerve fiber layer and thinning macular parameters like the ganglion cell complex or the ganglion cell inner plexiform layer, that’s internal corroboration that the measurements on the OCT are real, even in the absence of visual field changes.
“Finally, it’s worth looking carefully at the visual field again,” he says. “Often there are subtle visual field abnormalities or changes that, in the absence of these OCT measures, you might not consider to represent real change. If they match the changes in the OCT spatially, that’s corroboration that what the OCT is measuring is real. All of these strategies can be helpful when you’re trying to decide whether to treat the patient.”
However, Dr. Schuman adds an important caveat. “The threshold for making the decision to treat should be based on what the next treatment step is,” he says. “Your threshold should be higher if your next treatment step is the OR than if the next treatment step is adding a medication or doing laser trabeculoplasty.”
What about OCTA?
One of the latest iterations of optical coherence tomography is OCT angiography, which can reveal the functioning vasculature in parts of the retina. Could this help determine whether glaucomatous disease or progression is present when the OCT and visual field data disagree?
“OCT angiography has the potential to detect glaucoma progression,” notes Dr. Greenfield. “OCTA can measure vessel density with high repeatability and reproducibility. Studies have shown that capillary density measurements with OCTA are well-correlated with structure and function, and may be useful across a wide spectrum of disease severity.”
“Many of us are hoping that OCTA may be able to show that vascular changes occur before structural changes like retinal nerve fiber layer thinning, ganglion cell inner plexiform layer thinning and optic disc hemorrhages,” notes Dr. Chen. “If that turns out to be true, this technology might allow us to detect glaucoma and glaucoma progression even earlier than we can today using changes in the retinal nerve fiber layer or ganglion cells. Some longitudinal data supporting this has been published, but more studies are needed.”
“I think OCT angiography is very promising, in terms of what it might predict,” says Dr. Girkin. “It’s good for looking at the superficial and deep retinal vasculature. However, the critical vasculature that’s damaged in glaucoma is likely the intrascleral branches of the short posterior ciliary artery that feed the lamina cribrosa. I suspect that the defects seen in OCT angiography are just related to a loss of ganglion cells that, in and of itself, probably doesn’t cause glaucoma, although causality remains elusive.”
Dr. Girkin adds that the technology is very sensitive to background “noise.” “The whole idea behind OCTA is that it uses that noise to determine motion, so even a slight change in the signal-noise ratio can have a pretty significant effect on the OCTA scans,” he points out. “Despite these caveats, OCTA is showing great promise. But so far, I don’t think we fully understand how to use it in routine clinical practice.”
Dr. Schuman agrees. “A number of papers suggest that OCTA in the lab can provide additional information about eyes with glaucoma, but I’d say that in terms of clinical utility we’re probably not there yet,” he says. “We haven’t figured out how best to use that technology to detect disease or progression in glaucoma, but several groups, including our own, are working on this.” REVIEW
Dr. Girkin has received research support from Heidelberg Engineering in the past. Dr. Schuman is a consultant for Zeiss. Dr. Chen has consulted for Allergan in the past. Dr. Greenfield reports no relevant financial disclosures.
1. Nguyen AT, Greenfield DS, Bhakta AS, et al. Detecting glaucoma progression using guided progression analysis with OCT and visual field assessment in eyes classified by international classification of disease severity codes. Ophthalmol Glaucoma 2019;2:36-46.
2. Quigley HA, Dunkelberger GR, Green WR. Retinal ganglion cell atrophy correlated with automated perimetry in human eyes with glaucoma. Am J Ophthalmol 1989;107:5:453-64.
3. Budenz DL, Anderson DR, Feuer WF, et al. Detection and prognostic significance of optic disc hemorrhages during the Ocular Hypertension Treatment Study. Ophthalmology 2006;113:2137-43.


