For decades, dye-based angiography has been the gold standard clinical imaging modality for evaluating retinal and choroidal vascular pathologies.1-4 Despite their widespread success, fluorescein and indocyanine green angiography are invasive and time-consuming, in addition to having the potential for allergic reactions to the dyes.5 Moreover, FA is only a two-dimensional study focusing on the superficial retinal circulation, without the ability to visualize the deeper capillary structures, and ICGA is mostly useful for imaging the choroid.6,7 These limitations spurred the development of faster, safer imaging tools, capable of effectively imaging both the retinal and choroidal circulations, as represented by optical coherence tomography angiography. OCTA, however, still has several limitations of its own. Therefore, the important question of whether OCTA can completely replace conventional dye-based angiography in modern day clinical practice remains unanswered. Here, we’ll look at the pros and cons of both approaches.
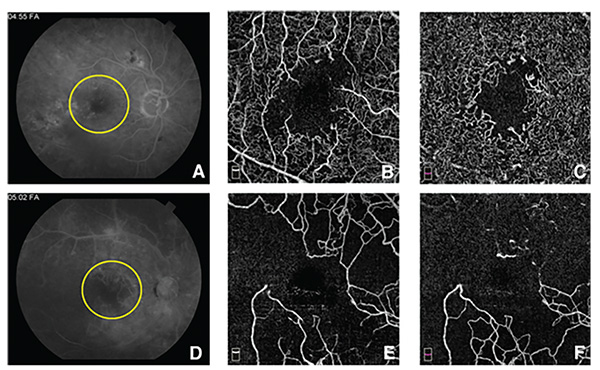 |
| Figure 1. A) Fluorescein angiogram of a patient with diabetic retinopathy during the late phase shows an enlarged foveal avascular zone (yellow circle). There are also areas of hyperfluorescence caused by leaking microaneurysms, as well as fluorescence blocked by intraretinal hemorrhage. Notice the obscuration of the edges of the FAZ by the leakage. B) En face optical coherence tomography angiogram of the superficial capillary plexus (SCP), highlights the extent of the FAZ enlargement, as well as the areas of capillary nonperfusion. C) En face OCTA of the deep capillary plexus (DCP), shows the extension of the capillary closure in the deep plexus, which can’t be appreciated on the FA. D) FA of another patient with diabetic retinopathy during the late phase also shows an enlarged FAZ (yellow circle), as well as large areas of nonperfusion. There are widespread leaking microaneurysms. E) En face OCTA of the SCP centered on the macula, shows extensive capillary nonperfusion that’s better appreciated here than on the FA. F) En face OCTA of the DCP of the same patient, depicting even more widespread capillary dropout at the DCP, largely unappreciated on FA. |
Weighing the Options
Using FA, the size and shape of the foveal avascular zone have long been considered important markers of foveal perfusion, with serious implications for photoreceptor integrity and central visual function.8-12 Unfortunately, FA only visualizes the boundaries of the superficial retinal capillary vasculature, and is easily obscured by leakage from surrounding hyperpermeable capillaries, further complicating the quantitative analysis of the FAZ.7,13 In contrast, OCTA provides a highly-detailed, depth-resolved, cross-sectioned, angiographic representation of the individual retinal capillary plexuses, facilitating qualitative and quantitative assessments of the perfusion state of the superficial, middle and deep capillary plexuses of the fovea, unobscured by leakage (Figure 1).14-18 This technology therefore yields an in-depth understanding of the three-dimensional consequences of retinal vascular pathologies, such as disorganization of the retinal inner layers in diabetic retinopathy, retinal vein and artery occlusions, sickle-cell retinopathy, acute macular neuroretinopathy and paracentral acute middle maculopathy.6,16,19-21
Dye-based angiography remains the gold standard for diagnosis, and occasionally for follow-up, of neovascular age-related macular degeneration.22,23 Despite their high sensitivity rates in detecting neovascular fronds, FA and ICGA still face a number of challenges in the clinic. Most relevant, nAMD is a complex pathology that requires long-term treatment and extended follow-up.24 The invasive, time-consuming nature of FA and ICGA impedes their practical use for the routine following of treatment responses. Moreover, fluorescence from subclinical choroidal neovascular lesions may be blocked by overlying pigment epithelial cells, impeding their early detection.25-27 Dye-based technology also doesn’t reveal the anatomical and structural effect of nAMD on the photoreceptor and RPE layers, which may, therefore, favor the use of OCTA for improved structural imaging of nAMD during therapy and follow up, as it may additionally reveal subtle changes that may affect vision, such as coexisting geographic atrophy.28-31
OCTA, on the other hand, is a quick and noninvasive tool that combines angiographic visualization of the exact site, size and extent of neovascular lesions, even those that may be missed by FA, together with cross-sectional representation of the retinal structure and the impact of the lesion on the outer retinal layers, as offered by OCT (Figure 2).25,32-34 It offers the convenience and practicality required for the frequent follow-up of these eyes.35,36 In terms of OCTA’s accuracy, one of these studies reported a 90-percent specificity rate when diagnosing different types of CNV,35 while another found that combining OCTA and structural OCT yielded a sensitivity rate of almost 86 percent in detecting type 1 CNV, compared to about 67 percent using FA.34 Another advantage of OCTA is its innate ability to visualize both retinal and choroidal vasculature equally, enhancing its ability to visualize retinal neovascular lesions, such as retinal angiomatous proliferation, subretinal neovascularization and other vascular changes in type 2 macular telangectasias, as well as choroidal lesions like CNV and polypoidal growths.37-40
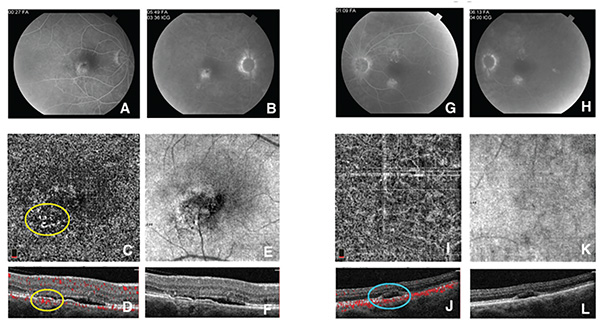 |
| Figure 2. A & B) Fluorescein angiogram of the right eye of a patient with central serous chorioretinopathy during the early venous (A) and late (B) phases. There is focal hyperfluorescence inferotemporal to the fovea, with equivocal increased fluorescence in the late phase. C & D) En face optical coherence tomography angiography at the level of the choriocapillaris (C) and cross section (D), shows a clear secondary choroidal neovascularization (yellow circles) located between Bruch’s membrane and the retinal pigment epithelium, confirming the diagnosis. E) En face OCT shows that the location of the CNV corresponds to the hyperfluorescent area seen on the FA. F) Spectral-domain OCT shows subretinal fluid as well as the elevated RPE, corresponding to the CNV. G & H) FA of the left eye of the same patient also shows two areas of hyperfluorescence that are suspicious for secondary CNV. I & J) En face OCTA at the level of the choriocapillaris (I) and cross sections (J) reveal the absence of CNV. (cyan circle). K) En face OCT shows absence of CNV (or RPE elevation) corresponding to the hyperfluorescence on FA. L) SD-OCT shows a pocket of subretinal fluid, with no signs suggestive of CNV. |
Fluorescein angiography, however, has a better sensitivity when detecting vascular lesions with low flow characteristics. OCTA operates by capturing two consecutive B-scans at each sampling location, from which the red blood cell flow information is extracted using various machine-specific algorithms. Vascular lesions with low, turbulent blood flow, such as microaneurysms and some polypoidal lesions, may thus fall below the detection threshold of OCTA.38,41,42 Dye-based techniques, on the other hand, are capable of capturing even small vascular lesions, such as microaneurysms, with very high sensitivity rates, regardless of their flow speeds.41
Another clear advantage of FA and ICGA over OCTA is their ability to capture a much wider area of the retinal and choroidal vasculature. The largest scanning area of commercially available OCTA is 8x8 mm, which covers a field of view of about 30 degrees, with the largest area available in prototype research OCTA machines reaching a FOV of 45 degrees.43 Despite the ability to montage these scans, the quality of the acquired images is negatively affected by increasing the size of the scanning area.44,45 This is an area where dye-based imaging easily outperforms OCTA; the former routinely delivers images with FOVs of 30 to 45 degrees, and has the ability to achieve widefield imaging of 60 to 120 degrees FOV, and most recently, ultra widefields of up to 200 degrees.46 The clinical benefits of these wider FOVs can’t be overstated. They provide invaluable information about peripheral changes due to diabetic retinopathy, as well as changes from such conditions as sickle-cell retinopathies and retinal vasculitis.47-50 In diabetic retinopathy, widefield FA is capable of demonstrating retinal ischemia and peripheral retinal neovascularization, with clear implications for the grading of retinopathy severity and management decisions (Figure 3).51-54
Another advantage of dye-based angiography is that its images are less liable to show artifacts than OCTA, and are, arguably, easier to interpret. Unfortunately, the intricate process by which OCTA detects motion of red blood cells to represent flow inherently brings with it an array of motion and projection artifacts.6,55 Various factors, including patient cooperation and the various imaging artifacts—especially those related to decorrelation tails (i.e., projection artifacts)—complicate the learning curve required to capture and interpret these images on OCTA.31,55,56 FA and ICGA, on the other hand, require much less patient cooperation, and are significantly less affected by artifacts.
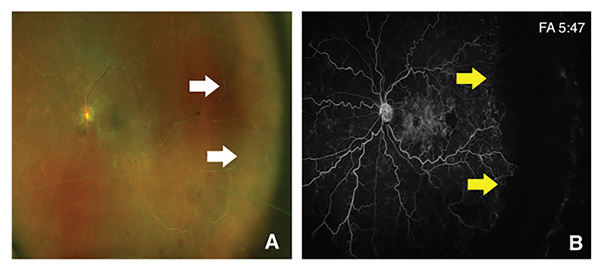 |
| Figure 3. A) Widefield fundus photograph of the left eye of a patient with an old ischemic central retinal vein occlusion, shows evidence of thin sclerotic vessels extending towards the periphery (White arrows). B) Widefield fluorescein angiography of the same eye during the late phase, shows markedly tortuous veins, with areas of leakage surrounding the fovea, and an area of nonperfusion temporal to the fovea. The widefield image allows the visualization of extensive capillary drop-out extending along the temporal periphery of the retina, denoting marked ischemia (yellow arrows). |
OCTA Innovations
Swept-source OCTA approaches may offer several advantages over spectral-domain OCTA in terms of the depth and resolution of the imaging.57-59 Compared to SD-OCTA, which uses a near-infrared diode light source with a central wavelength of about 840 nm, SS-OCTA uses a frequency-swept laser light source operating at a wavelength of 1050 nm.60 The longer wavelength reduces the scattering and absorption of the light waves by the RPE, and enhances its penetration into the deeper layers of the choroid.57,61 Furthermore, while SD-OCTA device speeds are about 70,000 A-scans/second, SS-OCTA can do 100,000 scans/second—and up to 400,000 scans/second in some research prototypes.33 The longer wavelength in SS-OCTA allows deeper imaging into the choroid, while the higher speeds have allowed widefield images with much greater resolution, further narrowing the gap between OCTA and dye-based imaging modalities.62-65
In conclusion, OCTA provides a convenient and noninvasive tool for documenting and following retinal and choroidal vascular pathologies, with valuable cross-sectional and three-dimensional displays. Despite these advantages, there’s still a lot more work to be done before the technology can be used in routine practice in all patients. OCTA’s limited FOV which precludes imaging of the retinal periphery, its potential for projection artifacts, its inability to visualize low-flow lesions, and its steep learning curve are areas that could be enhanced. These issues are the focus of active and diligent research, as well as software and hardware upgrades that are being developed by instrument companies. REVIEW
Dr. Fawzi is a professor of ophthalmology at Northwestern University’s Feinberg School of Medicine. Dr. Fayed is a visiting scholar and retina research fellow at Northwestern and assistant lecturer at the Department of Ophthalmology, Kasr Al-Ainy School of Medicine, Cairo University, Egypt. Dr. Fawzi can be reached at afawzimd@gmail.com or (312) 908 8152; Fax: 312-503-8152.
This work was funded in part by NIH grant DP3DK108248 (A.A.F.), and research instrument support was provided by Optovue (Fremont, California). The funders had no role in study design, data collection and analysis, decision to publish, or preparation of the manuscript.
1. Kikai K. Über die Vitalfärbung des hinteren Bulbusabschnittes. Arch Augenheilkd 1930;103:541-53.
2. Flocks M, Miller J, Chao P. Retinal circulation time with the aid of fundus cinephotography. American Journal of Ophthalmology 1959;48:3-6.
3. MacLean AL, Maumenee AE. Hemangioma of the choroid. Transactions of the American Ophthalmological Society 1959;57:171.
4. Novotny HR, Alvis DL. A method of photographing fluorescence in circulating blood in the human retina. Circulation 1961;24:82-6.
5. Yannuzzi LA, Rohrer KT, Tindel LJ, et al. Fluorescein angiography complication survey. Ophthalmology 1986;93:611-7.
6. De Carlo TE, Romano A, Waheed NK, Duker JS. A review of optical coherence tomography angiography (OCTA). International Journal of Retina and Vitreous 2015;1:5.
7. Weinhaus RS, Burke JM, Delori FC, Snodderly DM. Comparison of fluorescein angiography with microvascular anatomy of macaque retinas. Experimental eye research 1995;61:1-16.
8. Bresnick GH, Condit R, Syrjala S, Palta M, Groo A, Korth K. Abnormalities of the foveal avascular zone in diabetic retinopathy. Archives of Ophthalmology 1984;102:1286-93.
9. Mansour A, Schachat A, Bodiford G, Haymond R. Foveal avascular zone in diabetes mellitus. Retina 1993;13:125-8.
10. Lee CM, Charles HC, Smith RT, Peachey NS, Cunha-Vaz JG, Goldberg MF. Quantification of macular ischaemia in sickle cell retinopathy. British Journal of Ophthalmology 1987;71:540-5.
11. Gass JDM. A fluorescein angiographic study of macular dysfunction secondary to retinal vascular disease: II. Retinal vein obstruction. Archives of Ophthalmology 1968;80:550-68.
12. Balaratnasingam C, Inoue M, Ahn S, et al. Visual acuity is correlated with the area of the foveal avascular zone in diabetic retinopathy and retinal vein occlusion. Ophthalmology 2016;123:2352-67.
13. Hwang TS, Jia Y, Gao SS, et al. Optical coherence tomography angiography features of diabetic retinopathy. Retina 2015;35:2371.
14. Hwang TS, Gao SS, Liu L, et al. Automated quantification of capillary nonperfusion using optical coherence tomography angiography in diabetic retinopathy. JAMA Ophthalmology 2016;134:367-73.
15. Di G, Weihong Y, Xiao Z, et al. A morphological study of the foveal avascular zone in patients with diabetes mellitus using optical coherence tomography angiography. Graefe’s Archive for Clinical and Experimental Ophthalmology 2016;254:873-9.
16. Scarinci F, Nesper PL, Fawzi AA. Deep retinal capillary nonperfusion is associated with photoreceptor disruption in diabetic macular ischemia. American Journal of Ophthalmology 2016;168:129-38.
17. Nesper PL, Roberts PK, Onishi AC, et al. Quantifying microvascular abnormalities with increasing severity of diabetic retinopathy using optical coherence tomography angiography. Investigative Ophthalmology & Visual Science 2017;58:BIO307-BIO15.
18. Takase N, Nozaki M, Kato A, Ozeki H, Yoshida M, Ogura Y. Enlargement of foveal avascular zone in diabetic eyes evaluated by en face optical coherence tomography angiography. Retina 2015;35:2377-83.
19. Minvielle W, Caillaux V, Cohen SY, et al. Macular microangiopathy in sickle cell disease using optical coherence tomography angiography. American Journal of Ophthalmology 2016;164:137-44.
20. Chu S, Nesper PL, Soetikno BT, Bakri SJ, Fawzi AA. Projection-resolved OCT angiography of microvascular changes in paracentral acute middle maculopathy and acute macular neuroretinopathy. Investigative Ophthalmology & Visual science 2018;59:2913-22.
21. Onishi AC, Ashraf M, Soetikno BT, Fawzi AA. Multilevel ischemia in disorganization of the retinal inner layers on projection-resolved optical coherence tomography angiography. Retina. April 10, 2018 [epub ahead of print].
22. Bird A, Bressler N, Bressler S, et al. An international classification and grading system for age-related maculopathy and age-related macular degeneration. Survey of Ophthalmology 1995;39:367-74.
23. Cohen SY, Creuzot-Garcher C, Darmon J, et al. Types of choroidal neovascularization (CNV) in newly diagnosed exudative age-related macular degeneration (AMD). British Journal of Ophthalmology 2007;91:9:1173-6
24. Rofagha S, Bhisitkul RB, Boyer DS, Sadda SR, Zhang K, Group S-US. Seven-year outcomes in ranibizumab-treated patients in ANCHOR, MARINA, and HORIZON: A multicenter cohort study (SEVEN-UP). Ophthalmology 2013;120:2292-9.
25. Malihi M, Jia Y, Gao SS, et al. Optical coherence tomographic angiography of choroidal neovascularization ill-defined with fluorescein angiography. British Journal of Ophthalmology 2017;101:1:45-50.
26. de Oliveira Dias JR, Zhang Q, Garcia JMB, et al. Natural history of subclinical neovascularization in nonexudative age-related macular degeneration using swept-source OCT angiography. Ophthalmology 2018;125:255-66.
27. Roisman L, Zhang Q, Wang RK, et al. Optical coherence tomography angiography of asymptomatic neovascularization in intermediate age-related macular degeneration. Ophthalmology 2016;123:1309-19.
28. Leibowitz HM, Krueger D, Maunder L, et al. The Framingham Eye Study monograph: An ophthalmological and epidemiological study of cataract, glaucoma, diabetic retinopathy, macular degeneration, and visual acuity in a general population of 2631 adults, 1973-1975. Survey of Ophthalmology 1980;24:335-610.
29. Lanchoney DM, Maguire MG, Fine SL. A model of the incidence and consequences of choroidal neovascularization secondary to age-related macular degeneration: Comparative effects of current treatment and potential prophylaxis on visual outcomes in high-risk patients. Archives of Ophthalmology 1998;116:1045-52.
30. Chhablani J, Kim JS, Freeman WR, Kozak I, Wang H-Y, Cheng L. Predictors of visual outcome in eyes with choroidal neovascularization secondary to age related macular degeneration treated with intravitreal bevacizumab monotherapy. International Journal of Ophthalmology 2013;6:62.
31. Nesper PL, Lutty GA, Fawzi AA. Residual choroidal vessels in atrophy can masquerade as choroidal neovascularization on optical coherence tomography angiography: introducing a clinical and software approach. Retina 2018;38:1289-300.
32. Moult E, Choi W, Waheed NK, et al. Ultrahigh-speed swept-source OCT angiography in exudative AMD. Ophthalmic Surgery, Lasers and Imaging Retina 2014;45:496-505.
33. Novais EA, Adhi M, Moult EM, et al. Choroidal neovascularization analyzed on ultrahigh-speed swept-source optical coherence tomography angiography compared to spectral-domain optical coherence tomography angiography. American Journal of Ophthalmology 2016;164:80-8.
34. Inoue M, Jung JJ, Balaratnasingam C, et al. A comparison between optical coherence tomography angiography and fluorescein angiography for the imaging of type 1 neovascularization. Investigative Ophthalmology & Visual Science 2016;57:OCT314-OCT23.
35. Nikolopoulou E, Lorusso M, Micelli Ferrari L, et al. Optical coherence tomography angiography versus dye angiography in age-related macular degeneration: Sensitivity and specificity analysis. BioMed Research International 2018 Mar 7;2018:6724818 [online publication].
36. Costanzo E, Miere A, Querques G, Capuano V, Jung C, Souied EH. Type 1 choroidal neovascularization lesion size: Indocyanine green angiography versus optical coherence tomography angiography. Investigative Ophthalmology & Visual Science 2016;57:OCT307-OCT13.
37. Miere A, Querques G, Semoun O, et al. Optical coherence tomography angiography changes in early type 3 neovascularization after anti-vascular endothelial growth factor treatment. Retina 2017;37:1873-9.
38. Inoue M, Balaratnasingam C, Freund KB. Optical coherence tomography angiography of polypoidal choroidal vasculopathy and polypoidal choroidal neovascularization. Retina 2015;35:2265-74.
39. Gaudric A, Krivosic V, Tadayoni R. Outer retina capillary invasion and ellipsoid zone loss in macular telangiectasia type 2 imaged by optical coherence tomography angiography. Retina 2015;35:2300-6.
40. Toto L, Di Antonio L, Mastropasqua R, et al. Multimodal imaging of macular telangiectasia type 2: Focus on vascular changes using optical coherence tomography angiography. Investigative Ophthalmology & Visual Science 2016;57:OCT268-OCT76.
41. La AM, Kurt RA, Mejor S, et al. Comparing fundus fluorescein angiography and swept-source optical coherence tomography angiography in the evaluation of diabetic macular perfusion. Retina. Jan 16, 2018 [epub ahead of print].
42. Rebhun CB, Moult EM, Novais EA, et al. Polypoidal choroidal vasculopathy on swept-source optical coherence tomography angiography with variable interscan time analysis. Translational Vision Science & Technology 2017;6:6:4.
43. Salas M, Augustin M, Felberer F, et al. Compact akinetic swept source optical coherence tomography angiography at 1060 nm supporting a wide field of view and adaptive optics imaging modes of the posterior eye. Biomedical Optics Express 2018;9:1871-92.
44. Poddar R, Migacz JV, Schwartz DM, Werner JS, Gorczynska I. Challenges and advantages in wide-field optical coherence tomography angiography imaging of the human retinal and choroidal vasculature at 1.7-MHz A-scan rate. Journal of biomedical optics 2017;22:106018.
45. Wang L, Murphy O, Caldito NG, Calabresi PA, Saidha S. Emerging Applications of Optical Coherence Tomography Angiography (OCTA) in neurological research. Eye and Vision 2018;5:11.
46. Manivannan A, Plskova J, Farrow A, Mckay S, Sharp PF, Forrester JV. Ultra-wide-field fluorescein angiography of the ocular fundus. American journal of ophthalmology 2005;140:525-7.
47. Abucham-Neto JZ, Torricelli AAM, Lui ACF, Guimarães SN, Nascimento H, Regatieri CV. Comparison between optical coherence tomography angiography and fluorescein angiography findings in retinal vasculitis. International Journal of Retina and Vitreous 2018;4:15.
48. Penman AD, Talbot JF, Chuang EL, Thomas P, Serjeant GR, Bird AC. New classification of peripheral retinal vascular changes in sickle cell disease. British Journal of Ophthalmology 1994;78:681-9.
49. Vine AK. Severe periphlebitis, peripheral retinal ischemia, and preretinal neovascularization in patients with multiple sclerosis. American Journal of Ophthalmology 1992;113:28-32.
50. Magargal LE, Donoso LA, Sanborn GE. Retinal ischemia and risk of neovascularization following central retinal vein obstruction. Ophthalmology 1982;89:1241-5.
51. Patel RD, Messner LV, Teitelbaum B, Michel KA, Hariprasad SM. Characterization of ischemic index using ultra-widefield fluorescein angiography in patients with focal and diffuse recalcitrant diabetic macular edema. American Journal of Ophthalmology 2013;155:1038-44.
52. Sim DA, Keane PA, Rajendram R, et al. Patterns of peripheral retinal and central macula ischemia in diabetic retinopathy as evaluated by ultra-widefield fluorescein angiography. American Journal of Ophthalmology 2014;158:144-53.
53. Wessel MM, Nair N, Aaker GD, Ehrlich JR, D’amico DJ, Kiss S. Peripheral retinal ischaemia, as evaluated by ultra-widefield fluorescein angiography, is associated with diabetic macular oedema. British Journal of Ophthalmology 2012;96:694-8.
54. Hamanaka T, Akabane N, Yajima T, Takahashi T, Tanabe A. Retinal ischemia and angle neovascularization in proliferative diabetic retinopathy. American Journal of Ophthalmology 2001;132:648-58.
55. Gao SS, Jia Y, Zhang M, et al. Optical coherence tomography angiography. Investigative ophthalmology & visual science 2016;57:OCT27-OCT36.
56. Louzada RN, Talisa E, Adhi M, et al. Optical coherence tomography angiography artifacts in retinal pigment epithelial detachment. Canadian Journal of Ophthalmology 2017;52:419-24.
57. Potsaid B, Baumann B, Huang D, et al. Ultrahigh speed 1050nm swept source/Fourier domain OCT retinal and anterior segment imaging at 100,000 to 400,000 axial scans per second. Optics express 2010;18:20029-48.
58. Chinn S, Swanson E, Fujimoto J. Optical coherence tomography using a frequency-tunable optical source. Optics letters 1997;22:340-2.
59. Unterhuber A, Považay B, Hermann B, Sattmann H, Chavez-Pirson A, Drexler W. In vivo retinal optical coherence tomography at 1040 nm-enhanced penetration into the choroid. Optics express 2005;13:3252-8.
60. Wang RK, An L. Multifunctional imaging of human retina and choroid with 1050-nm spectral domain optical coherence tomography at 92-kHz line scan rate. Journal of biomedical optics 2011;16:050503.
61. Barteselli G, Bartsch D-U, Weinreb RN, et al. Real-time full-depth visualization of posterior ocular structures: comparison between Full Depth Imaging Spectral Domain OCT and Swept Source OCT. Retina (Philadelphia, Pa) 2016;36:1153.
62. Miller AR, Roisman L, Zhang Q, et al. Comparison between spectral-domain and swept-source optical coherence tomography angiographic imaging of residual choroidal vessels in atrophy can masquerade as choroidal neovascularization. Investigative ophthalmology & visual science 2017;58:1499-505.
63. Jung JJ, Chen MH, Chung PY, Lee SS. Swept-source on optical coherence tomography angiography for choroidal neovascularization after bevacizumab and photodynamic therapy. American Journal of Ophthalmology Case Reports 2016;1:1-4.
64. Tan CS, Ngo WK, Cheong KX. Comparison of choroidal thicknesses using swept source and spectral domain optical coherence tomography in diseased and normal eyes. British Journal of Ophthalmology 2014:bjophthalmol-2014-305331.
65. Ting DS, Cheung GC, Lim LS, Yeo IY. Comparison of swept source optical coherence tomography and spectral domain optical coherence tomography in polypoidal choroidal vasculopathy. Clinical & experimental ophthalmology 2015;43:815-9.