Optical coherence tomography has advanced significantly since it was first developed in 1991, but artifacts still remain. For glaucoma patients, OCT is used to assist with diagnosis, but if clinicians and technicians aren’t careful, they may end up with misinformation and an inaccurate interpretation of the results. Here, experts outline the various artifacts that can appear on OCT and how to detect and/or avoid them.
Reasons for Not Catching Artifacts
One reason artifacts get overlooked by clinicians is due to lack of time. “The most common reason that an artifact gets overlooked is that everyone has a busy practice and we don’t take time to review the raw images that constitute the result,” says Sanjay Asrani, MD, a glaucoma specialist at Duke Eye Center in North Carolina. “So, if you were to carve out extra time during the visit, or even afterwards, to review the raw images that make up that report, then identification of artifacts would become much easier.”
Another reason artifacts get overlooked is because clinicians have access to intelligent OCT devices, so they rely heavily on the report analysis rather than the raw images. “There’s progression analysis software that’s readily available,” says Lucy Shen, MD, the director of the Glaucoma Fellowship at Massachusetts Eye and Ear. “So, a lot of times people tend to look at that. If you look at that analysis, it doesn’t always show you the raw image and you’re more likely to miss the artifacts.”
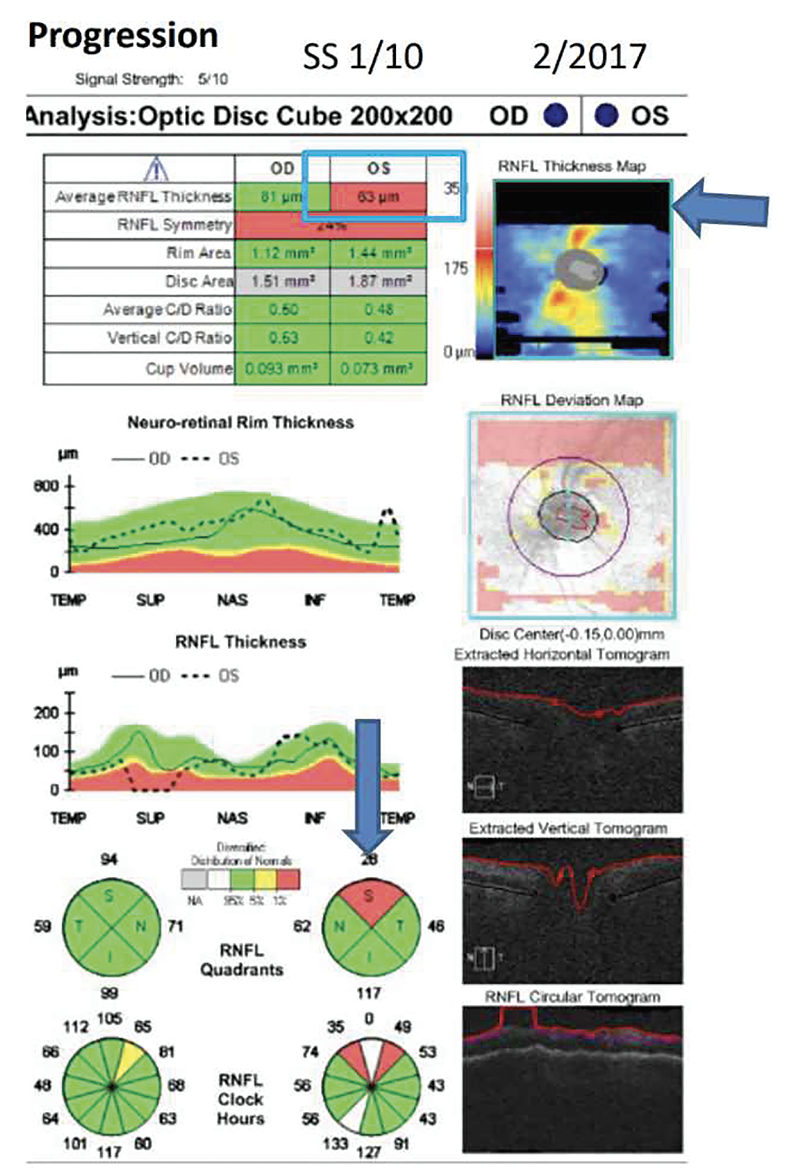 |
| Figure 1. An example of a missing data artifact mimicking glaucoma progression. Average RNFL thickness in the left eye was 63 μm due to missing data in the RNFL Thickness Map indicated by the arrow. |
Cirrus HD-OCT (Zeiss) is one OCT machine that offers progression analysis capabilities. This function uses a glaucoma progression-algorithm based on both event and trend analyses. It can obtain data samples of the retina nerve fiber layer as well as display RNFL thickness changes from baseline for each pixel in the scanned area.1
In order to make the best assessment of a progression analysis report, Dr. Shen recommends comparing the report with other OCT data. “When I look at OCT reports, I look at the raw images first and then I’ll look at the progression analysis, because the raw images usually tell me more about signal strength and also the artifacts are more visible,” she says. “If the raw images showed a lot of artifacts, then I wouldn’t even bother to use the measurement in the progression analysis. But, if the OCT looks like it doesn’t have many artifacts, then I would look at the progression analysis.”
There are various measures in an OCT scan that should be assessed by the clinician or technician. “The general rule is to spend some time looking at the details of the scan, not just the summary measures,” says Pradeep Ramulu, MD, PhD, the chief of the Glaucoma Division at Wilmer Eye Institute in Maryland. “Of course, some summary measures such as signal strength and scan quality should be assessed as well. One should also be aware of typical floor and ceiling measurements for the instrument you are using. If the whole scan or regions of the scan show values outside of the typical floor and ceiling values, that should make one highly suspicious of artifacts.”
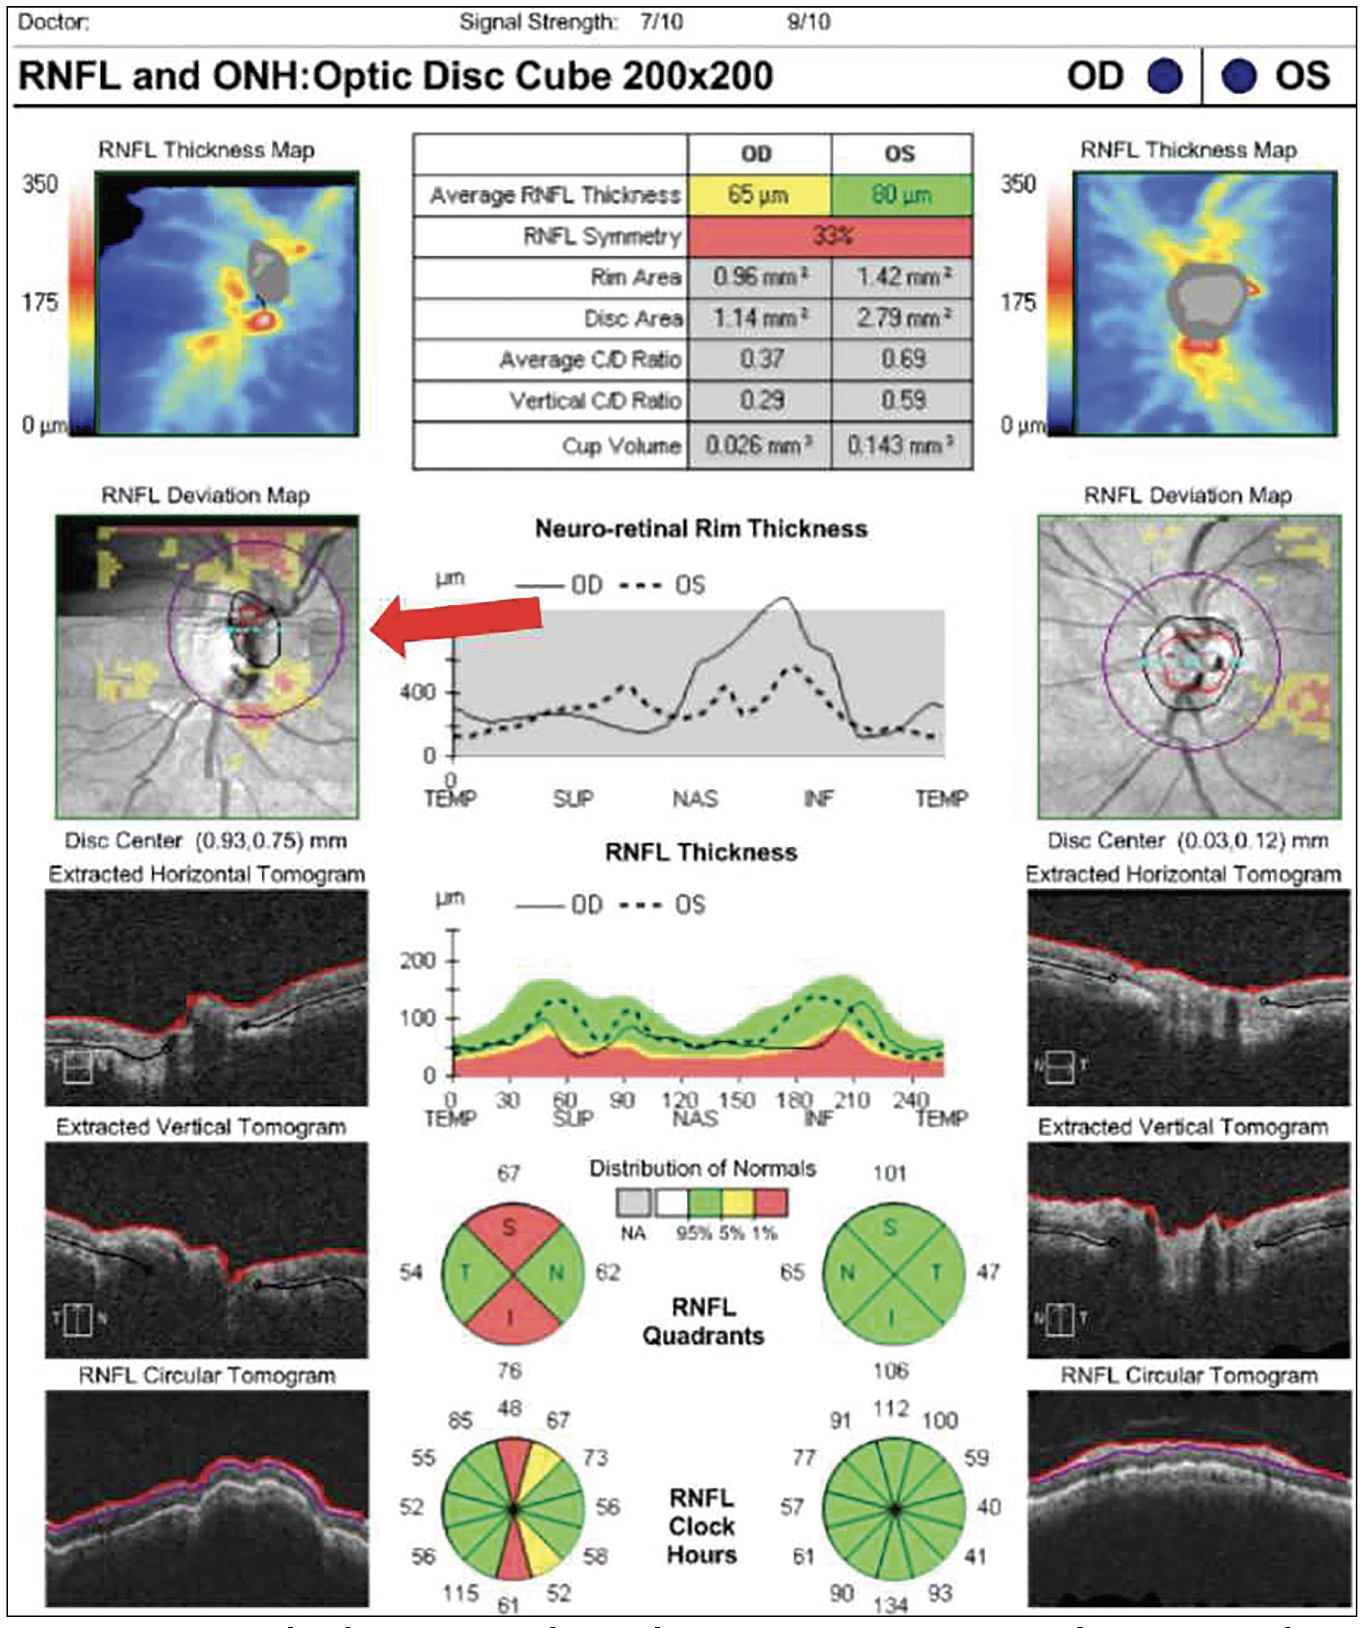 |
| Figure 2. An example of a motion artifact and erroneous measurements. The motion artifact appears as a horizontal line on the Deviation Map indicated by the red arrow. |
Another way to avoid and detect artifacts is by getting a second scan. “In cases where the artifact is due to a poor signal strength, the image isn’t very clear because the patient may have severe dry eye,” says Dr. Asrani. “Then, it’s absolutely a great idea to put in some artificial tears and repeat the scan or call the patient back on a different day when the eye isn’t so dry and then repeat the scan. If you do these scans at the end of an eye examination, then the ocular surface is quite dry, and the quality of the OCT scan isn’t going to be the best.
“Rarely it can happen that the technician didn’t place the OCT centrally on the optic nerve, or the image wasn’t centered in the window of acquisition, then the image edges got cut off and the OCT result is artifactual,” continues Dr. Asrani. “In such cases, again, it’s important to repeat the OCT scan, and you can identify the artifacts that have occurred when the thickness of the nerve fiber layer drops down to zero. Since that never happens in reality, any measurement of zero typically is an artifact. So, if you see a measurement of zero, there’s been an image cut off in that area typically.”
While a second scan can help uncover artifacts and assist with diagnosis, a second opinion from another clinician isn’t the best idea. “One thing to keep in mind is that different OCT devices measure differently,” says Dr. Shen. “If a provider were to get a second opinion from someone else and that doctor uses a different device, then they may not be helpful. You would have to look into providers in the same practice that can pull up the same series of OCTs to actually be able to provide an opinion. In other words, they’re not interchangeable.”
Currently, AI technology is being developed to assist clinicians and technicians with detecting artifacts. “Of course, this isn’t in clinical practice yet, but this is a research area of mine,” says Dr. Shen. “My colleagues and I started with a good OCT image and then manually generated artifacts. Then, we trained AI to be able to generate the correct image and compared that to the original.”
In Dr. Shen’s study, researchers inserted artifacts into 27,319 scans: 53.4 percent of scans had an artifact ratio of ≤10 percent, 46.6 percent had an artifact ratio of >10 percent and 18.4 percent had an artifact ratio of >20 percent. According to the results, the artifact correction accuracy in the retina nerve fiber layer thickness map had a mean absolute error of 10 µm among scans with a ≤10 percent artifact ratio, 8 µm among scans with a >10 percent artifact ratio and 11.1 µm among scans with a >20 percent artifact ratio.2 “Here we’re addressing just missing data artifacts,” says Dr. Shen. “We didn’t look at a lot of the other ones, but there are definitely efforts on the way to see how we can supplement the OCT device and improve the imaging quality.”
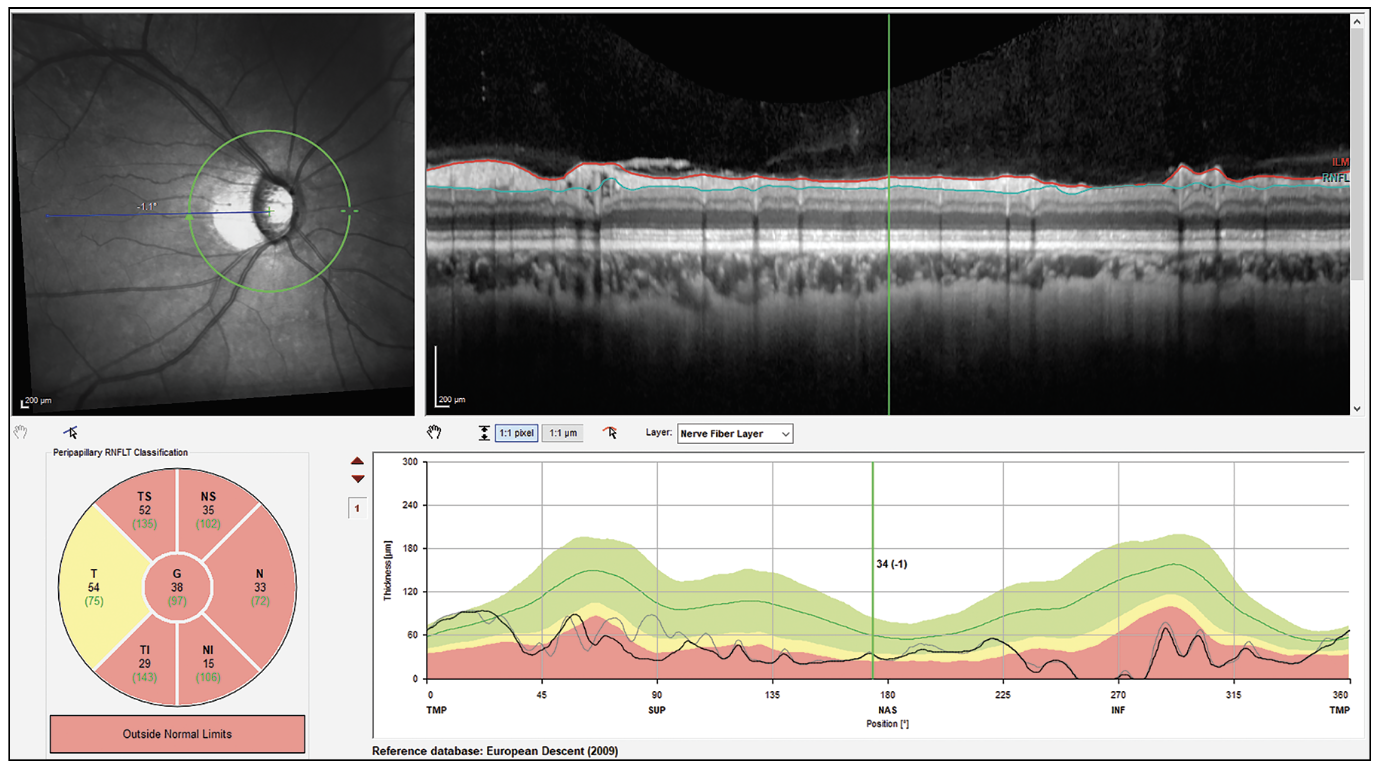 |
| Figure 3. High myopia segmentation artifact in patient with a schisis cavity in the nerve fiber layer. These cavities make the RNFL appear normal in thickness. |
Artifact Awareness
There are a number of artifacts that can appear during an OCT scan for glaucoma diagnosis. For example, in the study of one device, for whatever reason, the report included at least one artifact 46 percent of the time.3
“One source for artifacts for younger clinicians to be aware of is to not make the diagnosis based on the red, green, yellow colors that are printed on the report,” says Dr. Asrani. “Those are averages. Those are compared to normative databases, and those aren’t indicative of glaucoma, necessarily. However, it could be glaucoma. But, for example, if there’s a focal defect, it gets defined as a normal sector average thickness because the rest of the tissues are normal.
“The other example is if the sector’s thickness is low, it’s because there are shifted retinal peaks of the nerve fiber layer due to myopia, then those sectors may be classified as abnormal, or ‘Red,’” continues Dr. Asrani. “So, we don’t want to go just by the color indications on the report. We have to look at the entire picture by looking at the scans and segmentation so that we can identify correctly if this is glaucoma or not.”
Instead of assessing the red, green, yellow color indicators, there’s a simpler solution to diagnosing glaucoma. “It’s extremely rare for glaucoma to be symmetrical, except when both eyes are end stage, because asymmetry is the hallmark of glaucoma,” says Dr. Asrani. “If the clinician looks at the symmetry plot, or the symmetry graph, then they can adjust the two images side by side and see if there’s any symmetry, that’s one of the easiest ways of diagnosing glaucoma.”
Be aware of missing data in the OCT’s deviation map. “Missing data is common because if you don’t have the eye correctly centered, you’re not going to be able to scan all of the area,” says Dr. Shen. “If the missing data is within the scanning circle, usually the technician will scan the patient again, but if the missing data is outside the scanning circle, then often the technician will move on to the next patient to image.” (Figure 1)
Deviation maps can present artifacts that go undetected when looking at the raw images. Motion artifacts are a common example. “These are subtle and a little bit harder to detect because you don’t see it on the raw image,” says Dr. Shen. “If you look at the raw image, it looks nice and smooth. If you look at the deviation map and you notice horizontal lines and if they’re inside the scanning circle, then they get registered to become a thinning in the nerve fiber layer. Unfortunately, it’s hard to see it using progression analysis alone, but the best way to look at motion artifacts is with the deviation map.” (Figure 2)
Preexisting conditions, underlying pathologies and other diseases can increase the frequency of artifacts and lead to an inaccurate diagnosis. “One should be aware of other potential optic nerve diseases or retinal diseases that can masquerade as glaucoma,” says Dr. Ramulu. “Also, there can be abnormal thickening of the retina or nerve fiber layer in settings such as uveitis, diabetic macular edema or vein occlusion. These mistakes are particularly important as they can lead to unnecessary treatment for glaucoma, and failure to treat or address a different eye condition.”
Dr. Asrani explains further, “Artifacts may be due to an epiretinal membrane on the surface of the retina that makes it appear that the thickness is normal when in fact the tissues underneath it may have thinned out significantly,” he says. “Because it’s present on the surface (the segmentation), I’ll go over it and fix that up as the top part of the nerve fiber layer.
“Cysts, or schisis cavities, in the nerve fiber layer in myopic patients can cause the nerve fiber layer to look normal in thickness,” continues Dr. Asrani (Figure 3). “Also, uveitis causes edema of the nerve fiber layer. So, whenever there’s a coexisting diagnosis of uveitis, then OCT must be used with extreme caution, because what might appear as a normal nerve fiber layer may be artificially normal since it’s not made up of tissue but made up of fluid. Therefore, the results of the OCT have to correlate with the visual field in patients with uveitis.
“The correlation there is that sometimes treatment of uveitis causes the edema to decrease, making it appear as if the glaucoma is getting much worse because the tissue wears out,” continues Dr. Asrani. “Additionally, there may be real glaucoma progression in uveitic glaucoma, but because there’s active uveitis, the thinning of the tissue may not become apparent because of the swelling in the tissue.
“One of the most common artifactual conditions is high myopia, because the nerve is tilted, the retina is stretched and there may be a staphyloma,” continues Dr. Asrani. “Any of these conditions will cause the OCT to have artifactual results. The other thing is retinal pathologies such as a focal scar in the retina. That can cause nerve fiber layer loss. Also, severe hypertension can cause patients to develop multiple cotton wool spots. When these spots resolve, they result in a nerve fiber layer defect, and it looks like the patient’s glaucoma got worse.
“There are diseases that do masquerade as glaucoma, and they look exactly like glaucoma on an OCT when they’re actually neurological conditions,” adds Dr. Asrani. “So, these masqueraders need to be kept in mind, because you could be missing a life-threatening condition.”
Besides preexisting conditions, there are implants that can skew a glaucoma diagnosis. Dr. Shen conducted a study comparing artifacts in patients with a KPro implanted in one eye alongside patients without keratoprosthetics. All patients in the study had similar glaucoma progression. Through their findings, Dr. Shen and her colleagues discovered how KPro impedes the signal strength of the OCT. “Sometimes, in terms of signal strength, we have eyes that allow less light to travel back to the OCT device, such as a KPro implant that might be blocking that,” she says. “Since it’s a smaller optic, all the light has to shine through that small optic to image the back of the eye.”
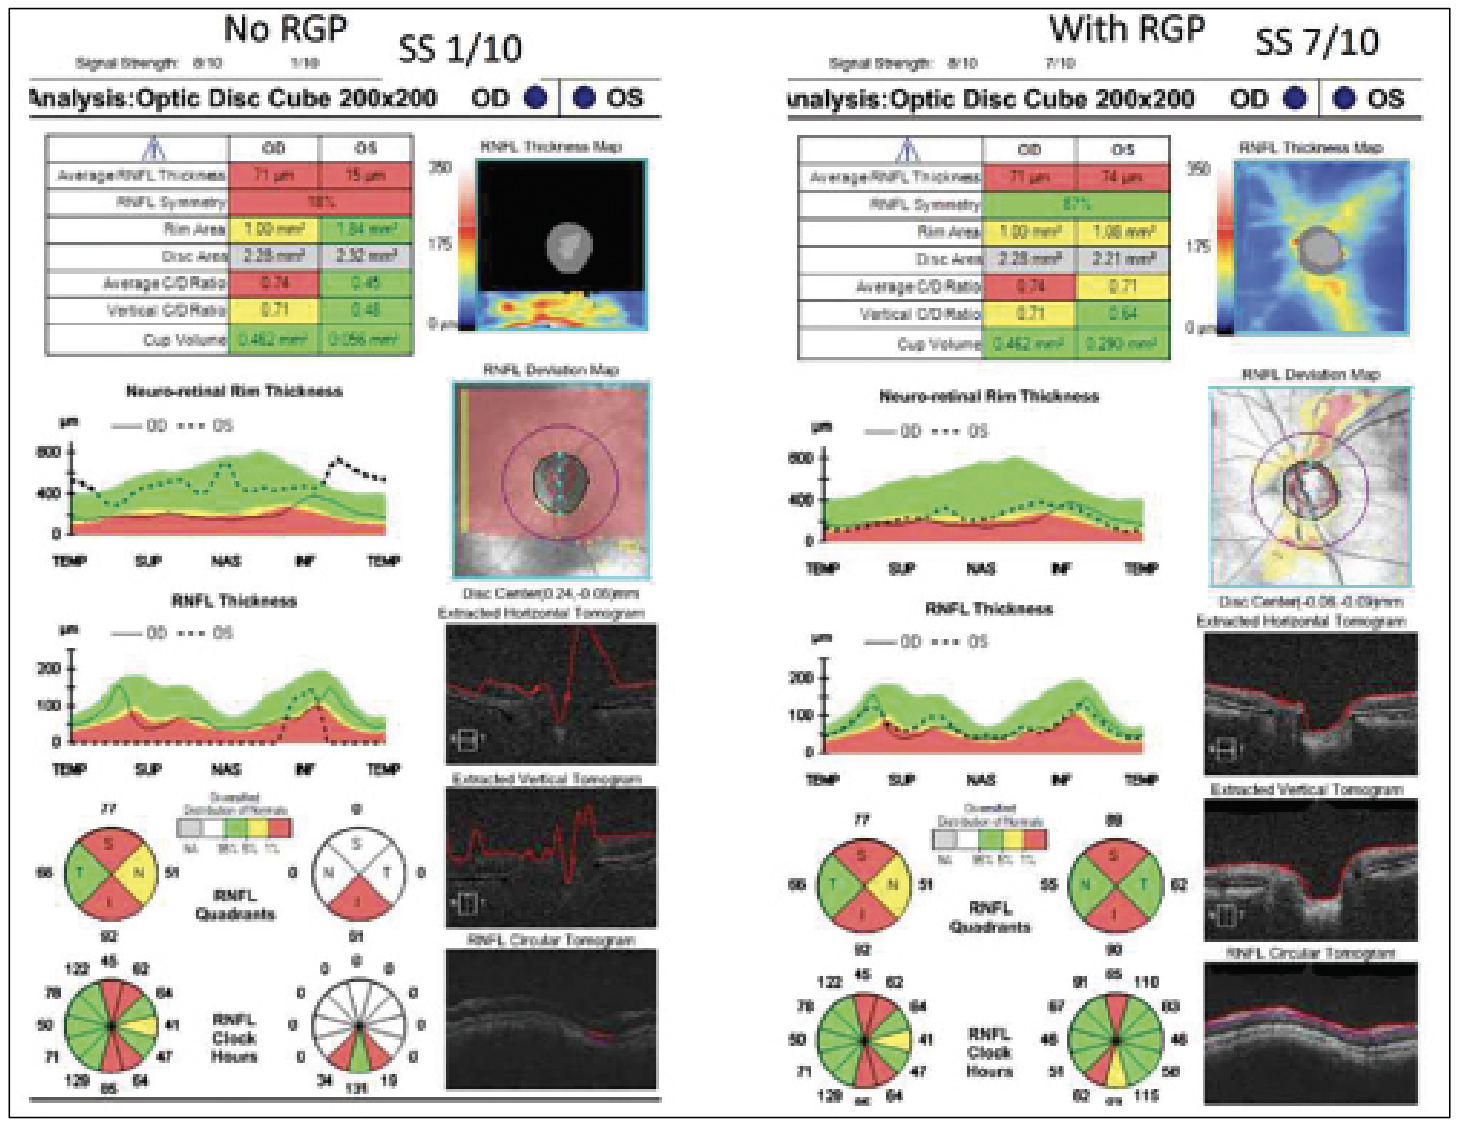 |
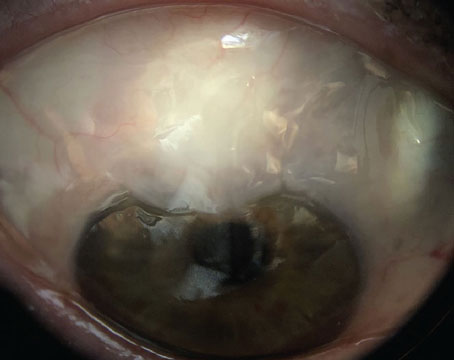
| Figure 4. (Left) An OCT report of a patient with keratoconus without a rigid gas permeable lens. (Right) An OCT report of a patient with keratoconus with an RGP lens. Both reports were taken using a Cirrus OCT device. Without the lens, less light can travel through the eye, resulting in missing data in the RNFL Thickness Map with a signal strength of 1/10. With the lens, no missing data was identified, and the signal strength was 7/10. |
Conversely, contact lenses can correct artifacts even in patients with high comorbidities and preexisting conditions. “For example, take a patient with keratoconus,” explains Dr. Shen. “If they look around and the cornea doesn’t focus the light, then light from the OCT can’t be focused; the signal strength is only 1 out of 10 [for the Cirrus]. However, these patients often walk around with a rigid gas permeable contact lens. Usually, the thought is that you want to take their contacts out or basically anything that’s blocking the eye to get the best image, but for these patients they should be wearing the contact lens for the imaging because it helps focus the light. It has also been helpful with high myopic contact lens users. Sometimes it helps a bit more in terms of how far you’re focusing with the OCT image, because these patients’ axial lengths are very different than normal.” (Figure 4)
OCT devices have given clinicians the power to make more accurate glaucoma diagnoses, and they should take advantage of all the information an OCT report provides. “It’s vital that we take the time to review the raw images off the OCT scans,” says Dr. Asrani. “Otherwise, we’re doing a disservice to our patients. This is the only way we can confirm that the artifacts aren’t present. Therefore, be sure to give enough attention to the OCT results.”
Dr. Asrani received an honorarium from Heidelberg Engineering. Dr. Ramulu is a consultant for Alcon Vision. Dr. Shen has no financial interests to disclose.
1. Kotowski J, Wollstein G, Folio LS, Ishikawa H, Schuman JS. Clinical use of OCT in assessing glaucoma progression. Ophthalmic Surg Lasers Imaging 2011;42.
2. Shi M, Sun JA, Lokhande A, Tian Y, Luo Y, Elze T, Shen LQ, Wang M. Artifact correction in retinal nerve fiber layer thickness maps using deep learning and its clinical utility in glaucoma. Transl Vis Sci Technol 2023;12:11:12.
3. Liu Y, Simavli H, Que CJ, Rizzo JL, Tsikata E, Maurer R, Chen TC. Patient characteristics associated with artifacts in Spectralis optical coherence tomography imaging of the retinal nerve fiber layer in glaucoma. Am J Ophthalmol 2015;159:3:565-76.e2.