Multifocal electroretinography (mfERG) is most useful in solving the common puzzle of a patient with poor vision who has a normal appearing retina. This test helps us discriminate between optic-nerve and retinal disease, detect early hydroxychloroquine toxicity, diagnose and distinguish between the various white dot syndromes and follow patients with inherited retinal diseases who have extinguished Ganzfeld ERGs. We describe the principles behind this new technology and present clinical examples so that the reader can better understand when to refer a patient for this specialized testing.
 |
| TBD |
 |
 |
| Figure 1. The typical mfERG setup includes a contact lens electrode on the cornea connected to an electrically isolated amplifier. The patient views a monitor displaying a rapidly changing sequence of hexagons. Using a cross-correlationtechnique, the software determines the electrical response of each of 131 segments in the posterior pole. For ease of pattern recognition, the software then generates a3-D waveform of the response density reflecting a much higher response in the normal foveal center. |
• unknown visual loss;
• distinguishing between optic nerve and retinal disease; and
• determination of hydroxychloroquine toxicity (Plaquenil toxicity).
In general, an abnormal mfERG indicates that the foveal cones and/or bipolar cell layers are dysfunctional and the source of vision loss. Unlike the focal ERG, mfERG also indicates the precise distribution of the retinal dysfunction. This precision helps correlate electrophysiologic findings with visual field testing. We find it most useful in assessing patients with visual acuity loss and a dearth of clinical findings. While we have used it to confirm non-organic visual loss, we have found it more relevant in the diagnosis of focal cone dystrophy and other similar disorders where mfERG is often the only abnormal test.
Technique and Normal Recordings
A typical multifocal ERG recording requires electrodes, an amplifier, a computer, a stimulating monitor and a monitoring camera. The hardware is united by VERIS software (Electro-Diagnostic Inc., San Mateo, Calif.). A typical multifocal ERG protocol takes about 20 minutes to complete both eyes individually. (See Figure 1). During multifocal ERG testing, the patient views a rapidly changing sequence on the monitor. The resulting electrical activity is recorded by an electrode, then amplified and analyzed. During stimulation the hexagons on the screen independently change every 13 milliseconds. They all follow the same pseudorandom sequence, with each hexagon starting at a slightly different position in this sequence. Using a cross-correlation technique, the software determines the retinal response from each of the 103 segments of the retina.
 |
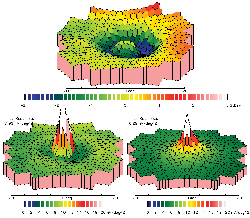 |
| Figure 2. Hydroxychloroquine toxicity. A 73-year-old asymptomatic female with an eight-year history of hydroxychloroquine use (at 7.5 mg/kg/day) presents with acuity of 20/20, a normal fundus appearance, Amsler grid and color vision. 2A. mfERG waveforms illustrate the classic appearance of hydroxychloroquine toxicity with a severe depression of the paracentral waveforms. 2B. 3-D representation shows the significant paracentral loss of retinal response. |
Because the procedure requires patient cooperation, it is difficult to perform in uncooperative children or those with tremors (e.g., Parkinson's, benign essential tremor). Multifocal ERGs have been recorded with portable systems in the operating room under anesthesia. The test has a similar reproducibility as a full-field ERG.
 |
 |
 |
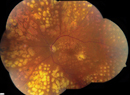
| Figure 3. Stargardt's disease: A 30-year-old female with "trouble seeing" and an acuity of 20/20. 3A. Mid-frame angiogram. 3B and 3C. mfERG 3-D plot and trace array and show the significant loss of the central peak and paracentral waveforms consistent with Stargardt's disease. The outer waveforms (ring 4/5) have a normal appearance, and the latency of the waveforms is normal. |
• Chloroquine and Hydroxychloroquine Retinopathy. Multifocal ERG testing can detect abnormal function in chloroquine retinopathy even when the full-field ERG appears normal and visible macular alterations are subtle. The mfERG of patients with retinopathy can be altered in many ways including generalized depression of the mfERG, loss of the central peak waveform, as well as a pericentral loss. We find that the pericentral loss pattern (See Figure 2) is most specific to hydroxychloroquine toxicity. We generally perform baseline mfERG testing in all patients who have any change in their 10-2 visual field test, Amsler grid or color vision. Subjects showing significant loss of mfERG response are asked to stop mediation. However, most subjects demonstrate a normal mfERG allowing them to continue hydroxychloroquine treatment despite an abnormal visual field test result. In this subgroup, we repeat mfERG testing yearly and consider changes in dosage only in subjects who show a worsening of retinal response.
Multifocal ERGs therefore help us better identify patients who are more likely to develop retinal toxicity. Almost as important, mfERGs provide psychophysical evidence to continue drug in those patients who have small changes in visual field testing.
• Stargardt's Macular Dystrophy. Caused by a mutation in the ABCA gene, recessive Stargardt's disease is one of the most common inherited conditions. Most cases can be distinguished on the basis of a clinical exam with a normal appearing fovea, flecks in the mid-periphery, and poor central vision.
However, there are many patients in whom the disease presents atypically with an absence of visible flecks and relatively spared central vision.
Ganzfeld ERGs in Stargardt's disease are non-specific. However, we have found mfERG quite useful in this circumstance (See Figure 3). The central peak and paracentral mfERG responses (rings 1 to 3) are markedly attenuated even in cases of preserved central vision. Correlatively, a normal multifocal ERG can help exclude Stargardt's disease.
 |
 |
 |
 |
| Figure 4. Retinitis Pigmentosa. This 32-year-old with VA of 20/20, OU, presented with progressive nyctalopia for the last five years. 4A. 3-D representation of the waveform illustrates the presence of a foveal peak with severely diminished midperipheral retinal response. 4B. Multifocal ERG responses illustrate the continued presence of central retinal cone function with a discernable waveform centrally. The perifoveal responses are diminished significantly. 4C. Optic nerve pallor, mild foveal granularity, as well as mid-peripheral pigment changes are noted. Arterial narrowing is also noted. 4D. Ganzfeld ERG of the right eye (black waveform represents patient response and blue waveform represents normal control), and illustrates the complete absence of cone and rod responses. |
• Occult Macular Dystrophy/ Focal Cone Dystrophy. Clinical features of occult macular dystrophy/focal cone dystrophy include unexplained gradual progressive visual loss, poor color vision, normal appearing fovea, and normal fluorescein angiogram. Electrophysiologic characteristics of OMD/focal cone dystrophy include a normal full-field ERG and a central loss of response density on multifocal ERG. Researchers testing eight patients with OMD with multifocal ERG found that the response densities of the multifocal ERG in the OMD patients were markedly reduced in the central 10 degrees of the retina. The multifocal ERG response densities of OMD patients approached the normal values toward the periphery.
On the other hand, most OMD patients had slight but significant prolonged latencies across the whole tested field. This difference in latency between the OMD subjects and the normal subjects did not change with eccentricity, implying that the retinal dysfunction has a broader boundary than expected by multifocal ERG response densities and perimetric results.
• Retinitis Pigmentosa. Generalized retinal degenerations such as retinitis pigmentosa are best followed by full-field ERG. In late stages of the disease, full-field ERG may be nonrecordable even in the presence of a demonstrable field by kinetic perimetry. We have found recordable, though attenuated, multifocal ERG responses in patients with RP. The multifocal ERG is an objective method for following patients with extinguished full-field ERG (See Figure 4). For example, the patient presented here has an extinguished ERG response, but a recordable and replicable mfERG. Such psychophysical testing allows us to objectively follow for change after intervention with vitamin/supplement therapy. Other researchers have found retinal dysfunction in patchy areas via mfERG in most carriers of X-linked retinitis pigmentosa.
• Branch Retinal Artery Occlusion. A localized "cookie cutter" de crease in response density is seen in BRAO's. This severe decrease follows the arterial supply pattern and persists even after the retina returns to its normal appearance. mfERG can thus be very helpful in the diagnosis of old BRAO where the retinal appearance is normal, and there is resolution of the vascular defect on fluorescein angiography. In our practice, such altitudinal defects can sometimes be difficult to distinguish from ischemic optic neuropathy. A well defined loss on mfERG (See Figure 5) points the way to a diagnosis of BRAO. Multifocal ERG thus offers a valuable tool for making this distinction.
 |
 |
| Figure 5 Branch Retinal Artery Occlusion. A 64-year-old female presented with an acuity of 20/30 and a decreased superior visual field in her left eye for four months. 5A. mfERG waveforms demonstrate severe loss of retinal function. 5B. The 3-D array confirms the severe loss in the superior visual field consistent with previous branch artery occlusion. |
In summary, mfERG is a unique objective method of determining outer retinal function and provides a basis for following patients with outer retinal diseases. We have found it enormously helpful in taking care of difficult-to-diagnose patients with retinal disease.
Dr. Maturi practices vitreoretinal surgery at Midwest Eye Institute. He has a special interest in difficult to diagnosis retinal diseases including toxicities. Ms. Bleau is a clinical research coordinator with 15 years nursing experience in ophthalmology. Contact Dr. Maturi at (317) 817-1414. The authors would like to thank Midwest Eye Foundation for support with this project.
 |
 |
 |
| Figure 6. AZOORS. A healthy 23-year-old male presented with a loss of vision which he described as "pizza pie" in appearance. The visual loss began suddenly and has remained stationary for some time. 6A illustrates a normal fundus exam. 6B. mfERG 3-D shows the severe loss of outer retinal response. 6c. mfERG waveforms illustrate retinal defects that correlate to the field. |