To monitor progression, doctors today primarily use visual fields and optical coherence tomography. In general, doctors are relying on OCT more than visual fields in early glaucoma, given that structural damage generally becomes evident earlier than the functional changes visual fields are designed to detect. Conversely, when disease is very advanced, many surgeons focus more on visual fields, since some (though not all) OCT tissue measurements stop changing—the “floor effect.” Meanwhile, during the long stretch between early and advanced disease, most surgeons rely on both technologies.
Our understanding of how best to use these technologies continues to evolve. Here, four surgeons with expertise in both visual fields and OCT share pearls for making the most of these technologies when managing glaucoma patients. In the first half of the article they discuss the use of visual fields; in the second half, they share pearls for making the best use of OCT.
Visual Field Testing: Frequency
Most doctors perform an OCT and visual field on a patient diagnosed with glaucoma at least once a year. Current research, however, suggests that other frequencies might be more helpful.
Felipe A. Medeiros, MD, PhD, distinguished professor of ophthalmology, director of clinical research and vice chair for technology at Duke University School of Medicine in Durham, N.C., has participated in research regarding the benefit gained from different rates of visual field testing. “Some of the previous work in this area assumed that doubling
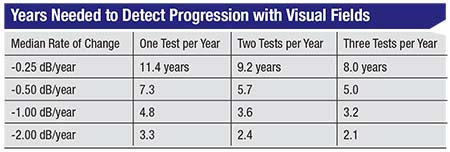 |
“In our study1 we looked at more than 1,000 eyes that had undergone multiple visual fields over time in order to estimate the time it would take to detect progression given a particular rate of change and a specific frequency of testing—one, two or three tests per year,” he continues. (See table, facing page.) For example, if you’re performing one visual field per year and the patient is progressing at 0.5 dB per year, which is about average for glaucoma patients, it would take you 7.3 years to detect progression. Doing two tests a year helps you detect progression sooner, but it doesn’t cut the time in half; it still takes 5.7 years. If you perform three visual fields per year, the time to detect progression drops again, to five years. Not surprisingly, the more tests you do, the faster you’ll be able to detect progression. However, the time it takes to detect progression does not decrease proportionately.
“Overall, what we’ve seen is that you make a significant gain moving from one visual field per year to two per year, but you get less of a benefit going from two to three tests per year,” he says. “This suggests that a good overall strategy is to do two tests per year. Of course, depending on circumstances, you might want to do more or less. If your patient has more severe disease, you might want to do a visual field more frequently. You could also do more testing at the beginning of follow-up, because that helps you determine whether the patient is progressing unusually fast. After that, you could test twice a year.”
Dr. Medeiros says that most clinicians don’t do as many tests as this data suggests are needed. “Some studies have found that the average number of visual fields obtained in glaucoma patients is less than one per year—sometimes only one every couple of years,” he notes. “That can be OK if the patient has very early glaucoma, or if the patient is a suspect. In that situation you could do more imaging instead, because imaging is more sensitive in the early stages, and just do a visual field once a year. For example, if the patient is an ocular hypertensive, you could do imaging more frequently and just do a visual field every two years. But if the patient has more advanced disease, he’s at risk of losing his vision from glaucoma and having functional impairment. In that case, you need to do visual fields more often—maybe even more often than twice a year.
“Of course,” he adds, “it’s important to remember that having a patient come in to the clinic three or four times a year for testing might be a significant burden for the patient. That has to be balanced against the need to detect progression.”
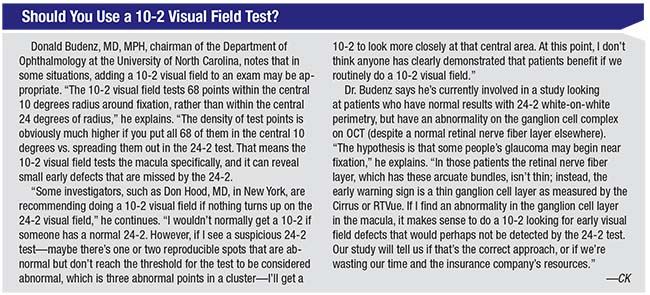
Donald Budenz, MD, MPH, chairman of the Department of Ophthalmology at the University of North Carolina, notes another factor that can influence how often visual fields are performed: concerns about reimbursement. “Many insurance companies limit the number of visual fields you can perform in the office each year,” he notes. “That’s a valid concern for the insurance companies because in decades past, eye-care providers would do a visual field every three months on glaucoma patients just so they could bill more often. As a result, the insurance companies put a limit on that. However, that doesn’t mean you can’t do more than one field per year.”
Dr. Budenz points out that you still may be able to get paid when you perform extra visual fields. “You have to document the medical justification for doing it,” he explains. “If you suspect progression but you need to confirm it before you adjust therapy, write that in your note. If the visual field has poor reliability and needs to be repeated for that reason, document that. Then, if you get a denial from the insurance company, have your people send it back in for review with your note. If the insurance company actually reviews the note they’ll see the medical justification for it, and chances are you’ll get paid. But if you don’t get paid, don’t worry about it. You’re doing the best thing for the patient.”
When to Repeat a Visual Field
Given the variability of visual field testing, knowing when to repeat a test is key.
• When first seeing a patient, get several visual fields in succession. “There’s definitely a benefit to doing two or three baseline visual fields in short order, because of the learning effect,” says Dr. Budenz. “Generally the visual fields will improve over the first few tests; if they’re spread apart and the patient is progressing you won’t realize it, because the test results are improving from the learning effect.
“You certainly don’t want to judge whether progression has occurred based on a single baseline field and one follow-up test a year later, so having a minimum of two baseline visual fields—three, if the first two don’t match—is really important,” he adds. “This is less of an issue with OCT, because OCT tends to be very reproducible as long as you have a good-quality scan, since there’s no OCT learning effect. That makes frequent early testing less important, although, ideally, you could get three scans at the same sitting when first seeing the patient to have more numbers to average. For most patients you can do an OCT every six months to a year, looking for change over time.”
• If a visual field looks suspicious for progression, repeat it. In contrast to trend analysis, which generates a slope of change over numerous tests, event analysis involves looking at the change suggested by a single visual field in comparison to two baseline tests. “Trend analysis is very helpful, but you need years of testing to see a statistically significant slope over time,” Dr. Budenz points out. “That’s why we also like to look at event analysis. The Humphrey perimeter can do trend analysis, but it also can do event analysis using the test-retest variability data that’s built into the machine. It takes your baseline data from two visual fields and compares the current test to that. If the change is more than the test-retest variability of the machine, it will indicate that there’s been progression.
 |
“When you do suspect progression, it’s essential to repeat the visual field,” he continues. “False positives are very common with visual fields, so there’s a good chance that a visual field that seems to show progression will actually return to baseline upon repeat testing. The worst thing you can do is advance therapy with a laser or surgery based on a single visual field. Chances are, if you repeat it, the visual field will return to baseline. And if the repeat field still looks worse, do a third field, because the Normal-tension Glaucoma Study showed that even two seemingly worse fields in a row can go back to baseline if you retest the patient a third time. Besides, the Glaucoma Progression Analysis software won’t give you a message of likely progression unless you’ve confirmed the worsening twice after the initial follow-up field suggests it’s worse. So you really need three follow-up fields to confirm progression.”
Dr. Medeiros agrees. “Every time you see a visual field that’s suspicious of progression, you need to confirm it,” he says. “In most cases, its not true progression; subsequent testing will revert back to what you had in previous tests. Even when the reliability indices are good, issues like patient fatigue or just test-retest variability can affect the result. Sometimes the patient is just having a bad day. Then the visual field may look worse, but it’s not actually worse.”
• If a visual field has a false-positive rate higher than 15 percent, repeat the test. “A false-positive rate higher than 15 percent indicates that it’s not a reliable test and needs to be redone,” notes Dr. Medeiros.
However….
• Don’t do repeat visual fields on the same day. “Multiple fields can be done in close proximity, but not on the same day,” says Dr. Budenz. “Patients become fatigued when they do even one visual field. Plus, there’s a phenomenon called retinal fatigue, which is physiologic and something we all suffer from when faced with repeated stimuli. So if you’re concerned about someone progressing, bring them back in in the future for repeat testing. How soon you bring them back depends on how concerned you are.”
Event vs. Trend Analysis
Dr. Budenz points out that progression can be identified in visual field data using either trend or event analysis. “Trend analysis is just plotting a parameter like average retinal nerve fiber layer thickness or mean deviation for the visual field index over time and seeing if there’s a downward trend that exceeds the normal downward trend associated with aging,” he says. “Change associated with aging is exceedingly slow, taking place over decades. In comparison, glaucomatous change generally takes place over years. There is some interest in a subgroup of glaucoma patients who have been labeled ‘fast progressors’ by Joseph Caprioli, MD, and the folks at UCLA. In those patients progression might be measured more in terms of months. But in general, clinical trials have found that the average glaucoma patient takes five to seven years to demonstrate progression.”
Despite the relative reliability of trend analysis, given that it incorporates many data points, Dr. Budenz points out that if you rely solely on trend analysis it can take a long time to detect progression. “Event analysis potentially can identify progression sooner because it focuses on a localized area,” he says. “Trend analysis uses what we call global indices, so the entire field has to be deteriorating for the visual field index or mean deviation to have a significant slope. In reality, we know that most patients progress focally; existing defects get deeper or bigger, and that kind of change can be picked up by event analysis. So it’s likely a more sensitive early indicator of progression. Trend analysis is important because you wouldn’t want to miss the whole field getting worse—but you wouldn’t want to miss localized change, either.”
However, Dr. Medeiros warns that you’re not likely to detect progression if you’re only comparing one test to another. “If you’re just doing visual fields every couple of years and looking at one printout and comparing it to the previous printout, you won’t be able to reliably detect progression,” he says. “There’s too much variability. You need to get a series of tests and look at the trend over time. Generally, that means two tests per year for patients who have glaucoma.”
Using OCT
Nathan M. Radcliffe, MD, clinical associate professor at the New York Eye and Ear Infirmary, observes that one of the best things about today’s OCT is that the platforms have generally been stable for the past five to seven years, resulting in comparable data over a significant period of time. “There have been software enhancements, but the way we’re measuring the retinal nerve fiber layer has been stable,” he says. “As such, all the data collected five years ago is still valuable. In fact, it becomes more valuable as time passes, because the older OCT data is, the more likely it is to help you prove that a given patient is either stable or has progressed. When spectral-domain OCT technology was new, we struggled to figure out if someone was stable or had gotten worse. But once you have five years of data, you can tell if the patient is stable. The OCT manufacturers did us a favor by creating stable acquisition platforms that don’t need to be changed every year.”
As with visual fields, an important question for a doctor monitoring glaucoma patients with OCT is how often to perform a
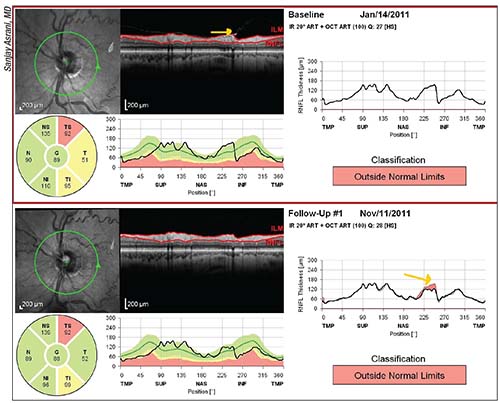 |
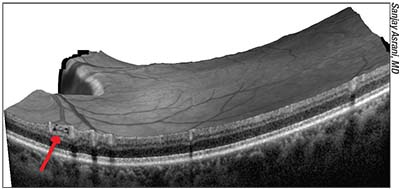
| Examining the raw images in OCT reports is a key way to avoid being fooled by something that appears to be progression but is not. In the example above, an epiretinal membrane was tugging on the retinal nerve fiber layer (top image, yellow arrow); a posterior vitreous detachment released the tissue (bottom image, yellow arrow in graph), making the RNFL appear thinner. That, in turn, triggered an erroneous warning that progression had occured at that location. |
Sanjay Asrani, MD, professor of ophthalmology at Duke University School of Medicine, director of the Duke Eye Center of Cary and head of the Duke Glaucoma OCT Reading Center in Durham, N.C., notes that doing an OCT more often than twice a year may not be helpful, except in specific circumstances. He says he typically does not perform an OCT more often than every five to six months. “I haven’t seen an OCT detect change if less than five months has passed,” he says. “Therefore, if I have to repeat an OCT, I wait at least five months. However, if I’m not sure whether I’m seeing progression and I’m concerned about that patient, I might have him repeat the OCT in three months to see if the change is real and reproducible. If it’s reproducible, then it’s most likely real, and I might step up treatment. But when patients are stable or have mild glaucoma, I won’t do an OCT more than once a year.”
Dr. Radcliffe urges doctors not to base OCT frequency on reimbursement. “Let what’s best for the patient be your guide,” he says. “Patients who are at low risk, whose pressure is controlled and who have mild or moderate disease can safely be checked once a year using OCT, although I wouldn’t scan less frequently than that. But when a patient has some other feature that puts him at higher risk, he can be checked more frequently. Don’t base this decision on reimbursement.
“For example, consider a patient who always produces a lot of false positives when he takes a visual field test,” he continues. “Why not get an OCT twice a year? That will cut your time to detect progression significantly, because the more data you have, the better you’re able to determine the slope of a line. Ultimately, it’s our confidence in the slope—meaning how quickly the patient is getting worse—that helps us determine the rate of progression, or whether progression has occurred. Or you may have someone whose pressure is wildly out of control, who also doesn’t do well with visual field tests. I might get an OCT on this patient every three months because there’s a high risk of progression. Knowing whether the patient is stable or progressing will immediately impact clinical decision-making. I don’t want to wait a year or six months for that.”
Acquiring the Data
These strategies can help ensure that the OCT data you capture is maximally useful:
• Scan the macula, not just the optic nerve. Dr. Radcliffe notes that over the past five years surgeons have begun looking for progression in the macula. “We’ve developed a good appreciation that glaucoma often affects central vision, even early in the disease,” he says. “If central vision is affected by glaucoma, that nerve damage—ganglion cell or retinal nerve fiber layer damage—will show up in the macula. So not only can we detect glaucomatous damage in the macula, we can now trace the progression of glaucoma damage in the macula.
“There are two ways to do that,” he continues. “One is by checking total retinal thickness, which incorporates the retina and the retinal nerve fiber layer. The other is by segmenting out the retinal nerve fiber layer, or the ganglion cell layer, at the macula. Our Zeiss OCT now has software for guided progression analysis of the macular retinal thickness or ganglion cell layer.”
• Get a baseline macula and optic nerve scan, together, at the patient’s first visit. “That first baseline is going to be very valuable,” notes Dr. Radcliffe. “It’s particularly important to do this if you think the patient is a glaucoma suspect, and it’s essential if the patient already has a glaucoma diagnosis and takes a drop.”
• Work continuously with your technicians and reinforce the importance of getting good scans. “I talk to my imaging techs every day,” says Dr. Radcliffe. “I remind them to scan the nerve and macula on every patient and make sure the patient is dilated. When a bad scan does come through, take the time to go and talk to the technician; re-educate him so you get the best scans. Don’t let it slide, because if you wait a month to fix the problem you’ll have a month of bad scans. That’s going to interfere with your ability to detect progression.”
Interpreting the Data
Once you’ve obtained good-quality data, it’s crucial to know how to interpret it. These strategies can help:
• When looking for change, focus on the supero- and inferotemporal quadrants. “Some doctors look for global thickness change, the overall average of the nerve fiber layer,” notes Dr. Asrani. “However, it makes more sense to look at the average thickness of the supero- and inferotemporal quadrants to see if there’s any change, because in the early to moderate stages of glaucoma the change is usually in those two quadrants. The average total thickness will include the nasal area, which typically does not change over time. That can hide change that’s occurring in the supero- and inferotemporal quadrants.”
• Look for change greater than 10 µm. Dr. Asrani says that a change smaller than 10 µm in the supero- and inferotemporal quadrants may not be real. “That’s because 5 µm is the intervisit variability of the machine’s measurements of the average thickness of the quadrant,” he explains. “One has to see greater than two standard deviations of that, a 10-µm difference, to be sure you’re seeing real change. Less than that could just be a variation falling within the machine’s accuracy limit.”
• Take into account the loss of tissue caused by aging—because OCT machines don’t. Dr. Medeiros points out that, unlike visual field instruments, OCT machines don’t account for potential loss of tissue caused by aging. “We know that people can lose nerve tissue as they age,” he says. “That’s particularly concerning with OCT, because you’re getting measurements such as the thickness of the nerve fiber layer. As you age, those measurements are likely to go down, giving you a false impression that glaucoma is progressing.”
Dr. Medeiros says his group
 |
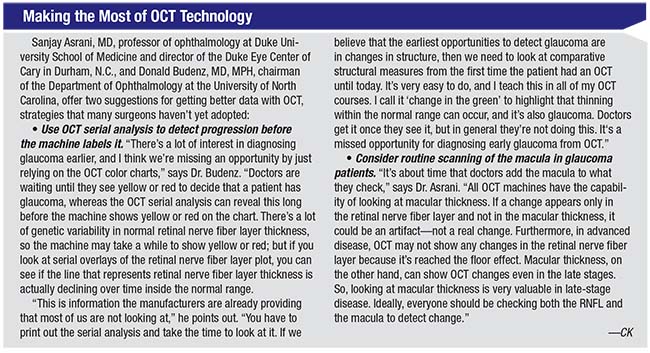
| In early glaucoma “schisis cavities” may form in the nerve fiber layer as axons disappear. These can create a “Swiss cheese” appearance on the scan (example above). If the internal limiting membrane suddenly collapses at that location because of the hollow NFL beneath, the drop in thickness may trigger a warning of significant progression. Looking carefully at the previous scan may reveal evidence of a schisis cavity, indicating that only a small physical change has actually taken place, not significant worsening. |
Dr. Medeiros points out that visual field machines have taken aging into account for decades. “We still don’t have that for imaging technology, but we need it,” he says. “Doctors are being misled into thinking that if they see progression on the OCT, it must be caused by glaucoma when it could be from aging. It’s an important point.”
• Look for arcuate-shaped changes in macular thickness to confirm progression. Dr. Asrani notes that there are plenty of artifacts that can cause the illusion of progression. “For example, the release of an epiretinal membrane might appear to be progression,” he says. “That can make it appear that the retinal nerve fiber layer area has thinned out at that location. But typically, if the progression is real, you’ll also be able to see it in the form of an arcuate-shaped loss in the macula thickness maps. If you just find a generalized thinning of the macula, that’s not caused by glaucoma.”
• If you see a sudden change in the thickness of the RNFL, go back and look for signs of schisis cavities in the nerve fiber layer. “One thing that can appear as a change in thickness on OCT is the collapse of the nerve fiber layer bundle,” Dr. Asrani explains. “This is something you may see in early glaucoma; the internal limiting membrane collapses because the nerve fiber layer was hollow. Sometimes that collapse has been evolving over time. When the collapse happens it will appear to be significant progression, but the collapse is actually a very small physical change.
“We call these hollow areas ‘schisis cavities’ in the nerve fiber layer, because the nerve fiber layer is thinning out as a result of those bundles of axons disappearing,” he continues. “It turns out that in many cases, you can see the hollow structures before they disappear; they have a ‘Swiss cheese’ appearance. So if one has the time and inclination, one can look at the raw images and at the nerve fiber layer itself to see if they have this appearance. If you look at the previous OCT scan, you might find that this type of nerve fiber layer change was in the area in which the roof collapsed.
“I typically look for this in all of my patients,” he adds. “I realize that not every clinician will have the time to look at each scan in such detail, but if I know that the nerve fiber layer is hollow, then I won’t be that concerned if the nerve fiber layer thickness suddenly changes dramatically at the next visit. Put another way, if you see a sudden change in thickness, it’s worth going back to the previous scan to see whether there was evidence of hollow tubes that were ready to collapse. If you find this, then what you’re seeing is probably not a significant worsening of the disease.”
OCT: Event vs. Trend Analysis
As with visual fields, OCT data can theoretically be interpreted by comparing tests or by looking at data trends over time. Dr. Budenz notes that although today’s OCT instruments provide trend analysis, they don’t do event analysis, although it should be possible. “If you know the precise test-retest variability of each clock hour or quadrant, then it should be possible to compare today’s value to a baseline value,” he says. “If the change is beyond the test-retest variability at that location, it could be flagged, and if the data is repeatable, you could diagnose changes focally, as we do with visual fields.
“We know that the smaller the measured area, the higher the variability,” he continues. “For instance, the variability at a single point would be very high since you can’t sample that exact same point each time. The least-variable parameter is average retinal nerve fiber layer thickness, due to signal averaging. The test-retest variability for average retinal nerve fiber layer thickness with the Cirrus OCT is between 4 and 5 µm, which is very good. So, any change greater than that is suspicious for progression, as long as you have good baseline and follow-up data.
 |
“Of course, we may want to look at the quadrants or clock hours, because glaucoma can progress focally,” he notes. “However, the variability increases as the area in question gets smaller and the number of data points shrinks. There’s also the problem of imperfect registration between scans. For clock hours, the variability might be as great as 8 to 12 µm. As a result, most doctors who attempt to use event-based progression analysis rely on average retinal nerve fiber layer thickness.
“In reality,” he adds, “I suspect most doctors don’t even attempt this. But I think we’ll eventually move toward automated event analysis for diagnosing focal change on OCT.”
Dr. Medeiros notes that relying on an OCT test-to-test comparison to detect change is fraught with pitfalls. He points out that although his recent study found that a change of more than 1 µm per year suggests a loss beyond that caused by aging, that rate of loss can’t be determined by simply comparing two OCT scans taken at different points in time. “When I talk about 1 µm of change per year, I’m not saying that the change from one test to the next test a year later is 1 µm,” he explains. “This rate refers to a trend of loss collected from a series of tests over time, not just from comparing one printout with another. It’s important to make sure the rate can be estimated with precision, and that requires multiple tests.
“Some people have suggested that a test-retest change of 5 µm in the average RNFL thickness on OCT is indicative of true progression,” he continues. “However, we need to keep in mind that 5 µm is actually about 10 percent of the dynamic range of the instrument. The average OCT nerve fiber layer thickness measurement in a patient who is 60 years old is about 90 to 100 µm. In very advanced disease, such as in someone who’s gone blind from glaucoma, the measurements never fall below 40 to 50 µm. That’s the floor effect. Therefore, the dynamic range of measurements is about 50 µm. When you take these numbers into account, you start to realize that a change of 5 µm is not that small—it’s actually 10 percent of the range of measurements. In order to detect smaller changes over time, you’ll need to look at the slope of change, obtained from a series of tests. And many tests are needed if one wants to obtain a precise estimate of the slope and detect small changes.”
OCT: Pitfalls to Avoid
As with most high-tech instruments, there are a host of ways your OCT data can be thrown off, leading to poor treatment decisions. To make sure your data is sound:
• Make sure all of your scans are of similar quality. “What this means, for example, is that if you dilate on that first exam, dilate at every exam when you see that patient,” explains Dr. Radcliffe. “Try to scan the eye in the same state, and get the same quality images you got at the first visit. Bad image quality or having the eye in different condition will end up hampering your ability to detect progression.”
• Beware of false positives. “Most doctors know how to manage false positives with visual fields, but false positives on OCT are more problematic because OCT is very reproducible and not subject to long-term fluctuation like visual fields,” says Dr. Budenz. “OCT can definitely produce false positives, so before you conclude that glaucoma is progressing, check for other things that might explain the positive result you’re seeing. It could be the result of poor signal strength, a change in positioning between scans, or some other cause. And of course, compare this result to what you’re finding on the visual fields.”
• To avoid being fooled by artifacts, always look at the raw OCT images. “You may find a pathology such as an epiretinal membrane,” notes Dr. Asrani. “Sometimes a measurement will be altered by something like a posterior vitreous detachment, or PVD. If the vitreous was tugging on the retinal nerve fiber layer and now has been released because a PVD occurred, the retinal nerve fiber layer will appear thinner. (See example on page 34.) It will look like progression, but it’s not.
“That’s something that can be detected by examining the raw image,” he adds. “The raw image will also let you confirm that the software has correctly identified the edges of the RNFL. Sometimes those thumbnail-sized images don’t clearly show the details, and if you can’t see the details, you can’t say for sure whether there has been progression.”
• Beware of thickness changes caused by uveitis. “One of our biggest discoveries in the past two years has been that when a patient has uveitis, the nerve fiber layer swells,” says Dr. Asrani.3,4 “If there’s any uveitis activity—either idiopathic uveitis or secondary uveitis post-surgery—the nerve fiber layer may appear thicker than it actually is. Swelling in the nerve fiber layer may lull the clinician into a sense of security that the glaucoma is not getting worse because the swelling keeps the nerve fiber layer thickness intact. In fact, the glaucoma may actually be getting worse.
“Then, if the uveitis is subsequently treated with steroids and controlled, the nerve fiber layer swelling will gradually disappear,” he continues. “That can dramatically reduce the nerve fiber layer measurement, making it appear that progression has occurred. It’s very confusing because the swelling happens in both the nerve fiber layer and the rim of the optic nerve, so even the optic nerve cupping appears to get bigger as the uveitis gets controlled. And it’s possible that at the same time prednisolone is causing the pressure to be borderline because it’s treating the uveitis. All of this makes it look like the glaucoma is rapidly getting out of control, and may lead the clinician to undertake aggressive treatment. In fact, all that’s happening is resolution of the nerve fiber layer edema.
“The ultimate message of the papers we published on this topic was that in patients with inflammation, retinal nerve fiber layer and macular thickness should be used with extreme caution for any baseline measurements or management of progression,” he says. “One needs to use visual fields in those cases.”
• Don’t be fooled if the visual field changes but the OCT does not. Dr. Asrani notes that when changes in visual fields and OCT don’t happen at the same time, clinicians may misinterpret what this means. “One must be aware that visual field changes in the early-to-moderate glaucomas will take place after the change has occurred in the OCT,” he says.
“What often happens is, we see a change on OCT, and when we’re sure that it’s a real change, we step up treatment,” he continues. “Then, a year and a half later, the visual field changes but the OCT doesn’t. That’s because the lost structure takes a long time to appear as a loss in function. At this point, many clinicians become confused; they may think the OCT is not working right, and given the change in the visual field, they may increase treatment even more. But all that they’re seeing is the natural progression of structure changing before function.”
Dr. Asrani notes that one reason many clinicians find this confusing is that not many have had the luxury of following patients with both OCT and visual fields for multiple years. “Some of us who have had both capabilities for a number of years have experienced this conundrum,” he explains. “I’ve been using the same OCT machine for eight years, so I can now share my experience. When the visual field changes but the OCT doesn’t, we start doubting the capability of our OCT. In that situation you have to be cautious about stepping up treatment if you’ve already stepped it up previously.
“Of course,” he adds, “if you haven’t stepped it up previously, this is a good time to do so.”
Coming: Structure & Function
Dr. Budenz sees help coming in the years ahead. “Some time soon we should have computers that can integrate information on progression from OCT and visual fields, using Bayesian analysis to come up with a probability score that someone with glaucoma has progressed,” he says. “It’s possible to do this today with either visual fields or OCT technology, but it will be great when the two sets of data can be integrated.
“There’s a lot of work still to be done,” he adds, “but I think that’s the direction in which we’re moving.” REVIEW
Dr. Budenz has no financial ties to any product discussed. Dr. Radcliffe has previously consulted with Carl Zeiss Meditec. Dr. Asrani receives lecture honoraria from Heidelberg Engineering. Dr. Medeiros has received consulting fees from Carl Zeiss Meditec and Heidelberg Engineering.
1. Wu Z, Saunders LJ, Daga FB, Diniz-Filho A, Medeiros FA. Frequency of testing to detect visual field progression derived using a longitudinal cohort of glaucoma patients. Ophthalmology 2017;124:6:786-792.
2. Wu Z, Saunders LJ, Zangwill LM, Daga FB, Crowston JG, Medeiros FA. Impact of normal aging and progression definitions on the specificity of detecting retinal nerve fiber layer thinning. Am J Ophthalmol 2017;181:106-113.
3. Moore DB, Jaffe GJ, Asrani S. Retinal nerve fiber layer thickness measurements: Uveitis, a major confounding factor. Ophthalmology 2015;122:3:511-7.
4. Asrani S, Moore DB, Jaffe GJ. Paradoxical changes of retinal nerve fiber layer thickness in uveitic glaucoma. JAMA Ophthalmol 2014;132:7:877-80.