One of the greatest recent developments in posterior segment imaging centers on the ability to evaluate posterior microanatomy in three dimensions. The traditional two-dimensional imaging techniques provide comparatively limited information in ocular health and disease states. For example, fluorescein angiography uses fluorescein leakage as a surrogate marker for macular thickness, while three-dimensional imaging of the retina can directly identify and quantitatively monitor findings such as macular edema and subretinal fluid. In this article, I will review some of the most common three-dimensional imaging techniques that are used to quantitate retinal thickness and macular edema.
Confocal SLO
Retinal and optic nerve head tomography represents a major technique to three-dimensionally assess the posterior segment. The technique involves confocal scanning laser ophthalmoscopy, in which laser scanning of the posterior segment is performed in a confocal fashion. The beam passes through the center of the pupil and is focused at the retina to a point size of about 8 to 15 mm. This limit is set by the optical properties of the human eye. Overall retinal illumination is reduced and contrast is improved as only a single spot is illuminated by the laser beam at any moment as it rapidly scans the posterior segment.
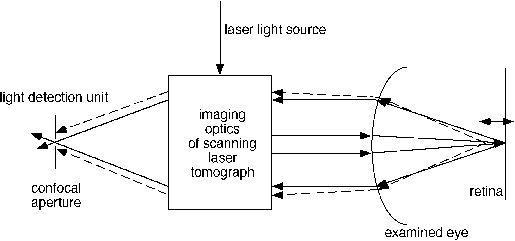 |
| Figure 1. Schematic of confocal scanning laser ophthalmoscope. Light from the confocal plane in the retina is imaged through a pinhole. The light originating from out of focus (dashed lines) is blocked by the confocal pinhole aperture. |
Reflected light exits the eye through the pupil and must pass through a confocal aperture before reaching a solid-state detector. This detector generates a voltage level based on the intensity of incoming light. Scattered light and light reflected from sources outside of the focal plane are blocked by the confocal aperture. The focal plane can be changed during the study to serially scan posterior segment structures at various depths. The Heidelberg Retina Tomograph (HRT, Heidelberg Engineering, Dossenheim, Germany), utilizes sophisticated software that can then generate a topographic map from this digital data set to study important structures in the posterior segment, such as the optic nerve head in glaucoma or the fovea in a macular hole.
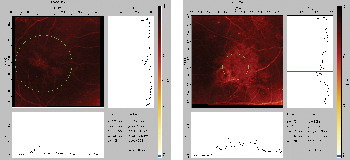 |
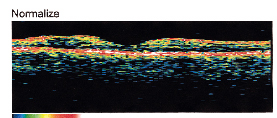
| Figure 2. Confocal scanning laser ophthalmoscopy macular edema maps in a 50-year-old man with diabetic macular edema. |
Optical coherence tomography is a laser technique that can be used for early diagnosis and monitoring of retinal and macular disease. With the eye dilated, an infrared laser is directed at the fundus. The OCT functions as an optical biopsy to provide two- and three-dimensional cross-sectional images of tissue microstructure, by collecting backscattering of light reflected from the fundus. Because of its high resolution, it can display not only changes in retinal thickness, but also damage to structures inside the retina such as retinal holes and changes in the vitreous.
OCT can perform circular scanning around the optic disc, composite scanning along one quadrant, and linear scanning of any design. Because OCT is based on near infrared interferometry, it does not project a bright light and causes minimal discomfort to the patient. The most recent version, OCT III (Carl Zeiss, Dublin, Calif.), yields impressive delineation of retinal substructures in both health and disease, in addition to retinal thickness measurements.
The retinal thickness analyzer (RTA, Talia Technology, Mevaseret Zion, Israel) produces a map of the retina, allowing accurate measurement of retinal thickness. In this technique, a thin laser slit beam is projected obliquely, through a dilated pupil, onto the retina, which is viewed at an angle in a similar manner to that of slit-lamp biomicroscopy. The reflected images are recorded by a video camera and digitized.
 |
| Figure 3. OCT of normal fovea, depicting the foveal depression, which correlates well with histologic cross sections of the retina. There is no evidence of subretinal fluid or macular edema, macular pucker or macular hole. |
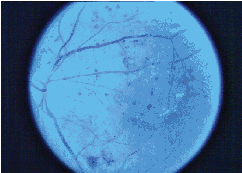 |
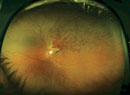
| Figure 4. Color fundus photo of diabetic macular edema. |
Another group used both techniques to measure the foveal thickness of 21 normal eyes and nine eyes with macular edema.3 With the RTA, the fovea was measured 10 times; with the OCT, six scans (one horizontal and five vertical cross-sections) of the fovea were obtained.
Mean foveal thickness of normal eyes measured 153 µm with OCT and 181 µm with RTA and coefficients of variation (CV) within the same subjects were 10 percent (OCT) and 9 percent (RTA), reducing to 9 percent (OCT) and 7 percent (RTA) when scans were repeated only five times for both methods. The RTA, however, yielded an interpatient CV of 33 percent (OCT, 17 percent), which was caused by several falsely high readings in normal individuals.
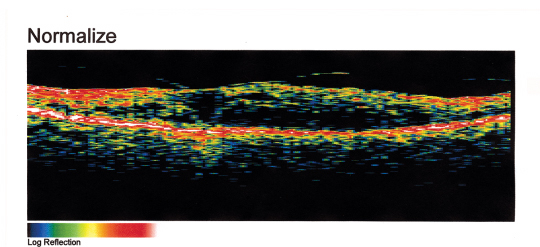 |
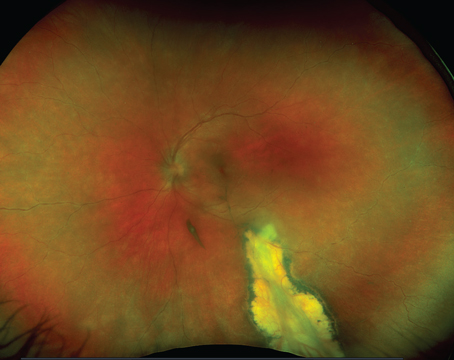
| Figure 5. OCT of the diabetic macular edema from Figure 4. Note that the normal foveal pit is absent and is replaced by intraretinal fluid and retinal thickening. OCT, HRT and RTA can be used to quantitate macular thickening before and after laser treatment of diabetic macular edema. |
In eyes with retinal thickening, the OCT measured a mean of 324 µm with 15 percent intra- and 58 percent interpatient CV. The RTA yielded a mean of 403 µm with CV of 18 percent and 73 percent, respectively. The authors concluded that both methods yield reproducible measurements of foveal thickness in normal individuals and individuals with macular edema, but that falsely high measurements may occur with the RTA, reducing its reliability as compared to the OCT.
However, another group concluded that OCT was less sensitive than RTA in detecting localized regions of thickening in early diabetic retinopathy when they compared OCT and RTA in 28 eyes from 28 patients with type 2 diabetes mellitus and mild nonproliferative retinopathy.4 Healthy populations were used to establish reference maps for the RTA and OCT using the means + 2 SDs of the values obtained for each location.
The RTA detected increases in thickness in one or more locations in 24 of the 28 diabetic eyes examined, while OCT detected increases in only three eyes. The percentages of increase detected by the RTA ranged from 0.3 to 73.5 percent, whereas OCT detected percentages of increase of 0.3 to 4.8 percent. The authors concluded that OCT is less sensitive than the RTA in detecting localized increases in retinal thickness in the initial stages of diabetic retinal disease.
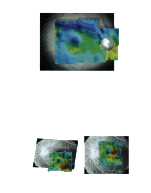 |
| Figure 6. The Retinal Thickness Analyzer can provide posterior pole thickness maps (top), and these can be correlated with fluorescein angiography in both two and three dimensions (bottom). In the example here (bottom), the two- and three-dimensional thickness maps depict thickening in the foveal region. |
Finally, another group compared all three techniques in assessing macular disease and thickness.6 RTA yielded good three-dimensional macular images displayed on a retinal thickness map, but the retinal thickness map did not demonstrate the thickened retina with dense retinal hemorrhages, and high backscattering from hard exudates obscured the vitreoretinal interface. HRT required longer time periods for image acquisition and sometimes yielded inadequate topographic images because of fixation movement. OCT yielded delineation of retinal cross-sectional structures, such as retinoschisis or cystoid spaces, that cannot be detected using other conventional methods with high resolution, but high reflectivity from dense hemorrhages can obscure the deeper layers of the retinal structures. Measurement of retinal thickness obtained with both the RTA and OCT was highly reproducible, and there was significant correlation between the retinal thicknesses measured with the two instruments.
In summary, three-dimensional imaging of the retina represents a major advance in the diagnosis and treatment planning of retinal disease, including not only macular edema, but other common macular disorders such as macular hole and pucker, as well as age-related macular degeneration. HRT, OCT and RTA are all reliable techniques that are being increasingly incorporated into clinical practice.
Dr. Ciulla practices in the Macula-Retina-Vitreous Section at Midwest Eye Institute. He holds no financial interest in any of the products or companies mentioned in this article. He recently co-edited a multi-authored textbook, Retinal and Optic Nerve Imaging (Lippincott), which reviews these and other new ultrasonographic and angiographic technologies to assess macular and optic nerve disorders.
1. Konno S, Akiba J, Yoshida A. Retinal thickness measurements with optical coherence tomography and the scanning retinal thickness analyzer. Retina 2001;21(1):57-61.
2. Polito A, Shah SM, Haller JA, Zimmer-Galler I, Zeimer R, Campochiaro PA, Vitale S. Comparison between retinal thickness analyzer and optical coherence tomography for assessment of foveal thickness in eyes with macular disease. Am J Ophthalmol 2002 Aug;134(2):240-51.
3. Neubauer AS, Priglinger S, Ullrich S, Bechmann M, Thiel MJ, Ulbig MW, Kampik A. Comparison of foveal thickness measured with the retinal thickness analyzer and optical coherence tomography. Retina 2001;21(6):596-601.
4. Pires I, Bernardes RC, Lobo CL, Soares MA, Cunha-Vaz JG. Retinal thickness in eyes with mild nonproliferative retinopathy in patients with type 2 diabetes mellitus: comparison of measurements obtained by retinal thickness analysis and optical coherence tomography. Arch Ophthalmol 2002 Oct;120(10):1301-6.
5. Konno S, Takeda M, Yanagiya N, Akiba J, Yoshida A. Three-dimensional analysis of macular diseases with a scanning retinal thickness analyzer and a confocal scanning laser ophthalmoscope. Ophthalmic Surg Lasers 2001 Mar-Apr;32(2):95-9.
6. Yoshida A. New examination methods for macular disorders--application of diagnosis and treatment. Nippon Ganka Gakkai Zasshi 2000 Dec;104(12):899-942.