Here, I’d like to discuss 10 of the most common artifacts associated with using OCT to diagnose and monitor glaucoma patients.1 Then, I’ll describe how any of these 10 artifacts can contribute to the phenomenon of “OCT diseases,” which can only occur if you have an OCT machine. These “diseases” occur when the OCT print-out presents us with an incorrect color classification of green, yellow or red, which can lead us to believe that the patient is doing well or poorly when the opposite is actually true. Lastly, I’ll talk about the pitfalls of OCT data when the same patient is tested using different OCT instruments or technologies.
The Top 10 Artifacts
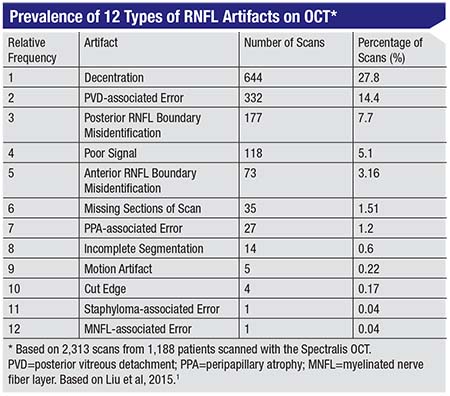
There are probably dozens of ways in which OCT measurements can be distorted, given the complexity of the technology. However, some artifacts occur more often than others. Let’s look at the top 10 OCT artifacts you’re most likely to encounter, going from least common to most common. (Although OCT can scan the retinal nerve fiber layer, the macula or the disc, the retinal nerve fiber layer is the most commonly used OCT parameter when following glaucoma patients. Therefore, this article will focus on the 10 most frequently encountered retinal nerve fiber layer artifacts.)
10 The edge of the scan is cut off. In this situation the data is incomplete because the scan is incomplete, most likely because the patient moved during the scan. The problem is that the machine will give you a measurement for the rest of the scan anyway. If the technician doesn’t realize that the patient has moved or notice that the scan is incomplete at the edge, the data may be saved and given to the doctor. This is one of many reasons that it’s important for your technicians to be educated about OCT artifacts; they’re often easy to detect. (If the technician does realize that this artifact has occurred, the scan should ideally be repeated.)
9 Motion artifacts. This is data distortion that results from the patient moving during the scan. In this particular artifact, the patient moves so much that parts of the scan may fall outside of the rectangular display box on the printout. The resulting data is generally not usable.
An error of this kind should also be easy to spot if the technician knows to look for it. Consider how a typical OCT scan of the nerve fiber layer appears. A typical OCT scan is black at the top and the bottom of the printout, with horizontal white segments running across the middle of the page from side to side representing the many layers of the retina. The top-most layer of the retina is the retinal nerve fiber layer, which is usually represented by a white horizontal linear segment; two colored lines depict the front and back borders of the retinal nerve fiber layer. The computer then calculates the retinal nerve fiber layer thickness, delimited by the two colored lines.
If there’s a motion artifact, the retinal nerve fiber layer may appear to zigzag. (See examples on page 48.) One or both of the colored lines may also look out of place. If the patient moved a lot, parts of the scan may simply be missing.
If the technician knows to look for this type of artifact and sees that it has happened, the technician should instruct the patient to hold still and repeat the scan.
8 Incomplete segmentation. Segmentation refers to the computer deciding where the borders of the
 |
If neither the technician nor the busy ophthalmologist notices that the colored lines are incomplete, the doctor won’t realize that the data is garbage and should be discounted. The doctor may not be able to make clinical decisions based on this in-complete information.
7 Peripapillary-atrophy-associated error. Peripapillary atrophy is a common abnormality that can occur in the vicinity of the optic nerve; it’s often seen in older patients and patients who have glaucoma. Usually the OCT scan circle is larger than most PPA, so most scans are not affected by it. However, in patients who have really large areas of PPA, the OCT machine will scan over it. Because certain layers of the retina are missing in an area of PPA, the machine will give a funny retinal nerve fiber layer thickness value.
If this happens, the overlap will be visible on the printout. If you see that the OCT scan circle extends over the area of PPA, you should know that the retinal nerve fiber layer thickness value will not be accurate. In some cases, when you look at the printout, the colored lines will zigzag around, indicating that the computer wasn’t able to accurately determine the borders of the retinal nerve fiber layer.
Only a very experienced technician would be likely to catch this problem and realize that the scan needs to be redone, offsetting the green circle to avoid the PPA (if possible). In most cases, the physician will have to be the one to catch this.
6 Missing sections of the scan. Middle parts of a scan may be missing because something inside the eye, such as a floater, prevents data from being collected in one or more areas. As a result, the printout won’t show any retinal nerve fiber layer in that area, and there will be a black space (or spaces) instead. In those areas the data is missing, and the retinal nerve fiber layer values in those regions—if any values are even generated—should be disregarded.
This type of error is obvious if you look at the scan. However, the doctor may not take the time to stop and look, or may not realize the significance of the gaps.
5 Misidentification of the anterior boundary of the retinal nerve fiber layer. In this situation the machine has made a mistake when drawing the top colored line representing the top border of the retinal nerve fiber layer. The resulting measurements can
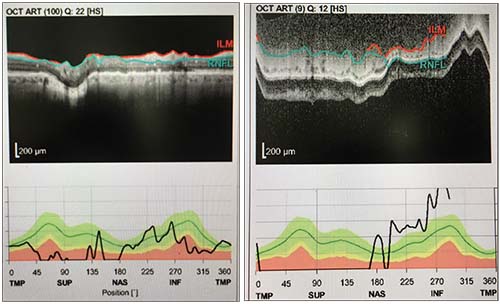 |
| Multiple artifacts can occur in the same scan. A motion artifact caused by patient movement affected the data in the left-hand scan above, making the retinal nerve fiber layer appear to zigzag. The scan on the right shows both a movement artifact and incomplete segmentation; the colored lines don’t reach from side to side. |
4 Poor signal. Common causes of this artifact are dry eyes and cataracts. If there is a cataract, the OCT beam is partly blocked from reaching the nerve tissue it’s trying to measure. It’s like looking through frosted glass instead of a clear windowpane. The resulting picture will look grainy or blurry, and the contrast between the gray retinal layers and the white retinal layers will be indistinct. You should be able to see this when looking at the scan. If the borders of the retinal nerve fiber layer are blurry, the machine will have a hard time figuring out where to draw the colored lines or retinal nerve fiber layer borders.
If the poor signal is caused by dry eyes, putting a drop of artificial tears on the eye before retaking the scan will help—assuming the technician recognizes the problem. Of course, this won’t help if the problem is an early cataract, but I tell my staff to have the patient blink or try artificial tears if the scan is blurry, to see if it solves the problem.
3 Misidentification of the posterior retinal nerve fiber layer boundary. In this case, the bottom colored line is incorrectly delineated. Interestingly, this is usually due to glaucoma, because glaucoma not only causes retinal nerve fiber layer thinning but also causes the retinal nerve fiber layer to become less reflective. That’s a problem because OCT technology creates a cross-sectional picture of the eye based on differences in tissue reflectivity. So instead of getting a normally bright, highly reflective, white retinal nerve fiber layer, that tissue becomes kind of grayish and less differentiated from the background noise and the underlying retinal layers. This glaucomatous change makes it harder for the machine to identify the back boundary of the retinal nerve fiber layer. It’s easy to understand why this artifact is a common problem in glaucoma patients.
If you encounter this artifact, the ma-chine’s resulting measurements can be either too big or too small—or even zero. When a doctor sees a retinal nerve fiber layer thickness value of zero on the printout, the doctor can immediately tell that this is an artifactually low and incorrect measurement. A retinal nerve fiber layer value of zero is physiologically impossible even in the most advanced stages of glaucoma, because even after complete loss of nerve tissue, at least 50 µm of non-neuronal tissue, such as glial tissue and blood vessels, will remain. (This is called the “floor effect.”) Therefore, a retinal nerve fiber layer thickness value of zero is always an artifact; real measurements can never fall below 50 µm.
On the other hand, if the data indicate that the retinal nerve fiber layer is very thick, that’s harder to notice and identify as an artifact. All the technician and doctor may see is that the tissue is labeled as being normal—an example of “green disease,” where the machine erroneously says the patient is healthy when he may actually have advanced glaucoma.
You should be able to see that misidentification of the posterior retinal nerve fiber layer boundary has occurred if you look at the scan; the location of the lines will show that the machine has incorporated layers below the retinal nerve fiber layer into its measurements. (It might be a bit much to expect a technician to catch this.)
2 Posterior vitreous detach-ment-associated error. A posterior vitreous detachment is a normal degeneration of the eye associated with aging; it results in floaters. Most people develop this problem eventually. In the normal evolution of the PVD, the PVD may pull on the surface of the retina, causing the OCT’s measurements to be artifactually thick. On the other hand, when a PVD releases, one may find artifactual thinning of the nerve fiber layer. In still other cases, if the PVD is floating freely in the vitreous and is not adherent to the retina, it may not affect the measurement at all.
This is another phenomenon that should be easy to spot if you look at the scan. If you do see a PVD in the scan, you have to look at it carefully and consider the possibility that it may be affecting the measurements.
1 Decentration. This is the most common OCT
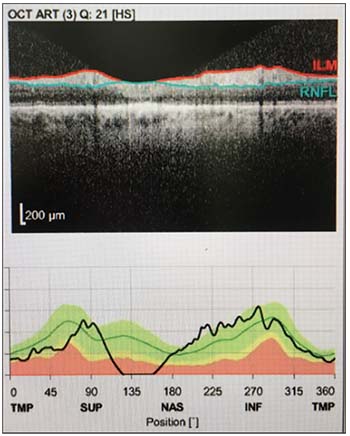 |
| In this scan the OCT machine has misidentified the posterior retinal nerve fiber layer boundary, leading to erroneous thickness measurements. |
Like many of the other artifacts we’ve discussed, this should be easy to see if you take the time to look at the scan to make sure that it’s properly centered.
Red, Yellow & Green Disease
One reason it’s easy to miss artifacts when they occur is that OCT machines are designed to make things easier by telling us if the patient’s measurements are normal or not in comparison to a normative database; they can tell us if our patient’s retinal nerve fiber layer thickness value is thicker, thinner or similar to what is expected for a normal patient without glaucoma.
If your patient’s measured values fall within what’s normal for most healthy people, the machine will label that section of the tissue green, or normal. Conversely, if the value is thinner than what’s been measured in normal eyes, the machine will show a red color to indicate that the patient probably has glaucoma. If the value is borderline, the machine will show yellow. When the colors are wrong due to one of the top 10 artifacts (or because of a nonglaucomatous disease), we refer to this problem as green, red or yellow disease. This means that the OCT machine gave the wrong diagnosis and incorrectly labeled the patient as either normal (green disease), having glaucoma (red dis-
ease) or having borderline measurements (yellow disease).
A lot of busy doctors in the clinic just look at the colors on the printout; if all the colors on the printout are red, they may assume the patient has glaucoma. But if you don’t take the time to look at the rest of the printout, you risk running into trouble. Some of the time, the machine is correct. If you see green all over the printout, the patient is probably normal and doesn’t have glaucoma; if the machine shows red, the tissue may in fact be thinner as a result of glaucoma. However, some of the time the machine will be wrong because of these artifacts. As already noted, most artifacts are easy to spot—if you take the time to look at the printout, not just at the colors the machine is using to label each segment of tissue.
How often do these “OCT dis-eases” actually occur? One study found that a quarter of the time when the machine showed yellow, the patient was actually normal, after the segmentation errors were manually corrected.2 Therefore, the incidence of yellow disease could be as high as 25 percent.
Strategies for Success
To avoid being fooled by an OCT artifact:
• Always look at the entire printout. When an OCT artifact goes unnoticed, the reason is almost always the same: The doctor failed to look at the entire printout. In a busy clinic, pressed for time, the easy thing to do is just look at the colors on the chart. If everything’s green, the patient is fine. On to the next patient!
Most of the time, the machine’s analysis is probably trustworthy. But now and then, artifacts occur. If you take a moment to look over the entire printout for signs of an artifact, you’ll catch them when they do occur. If you don’t, sooner or later you’ll make an important clinical decision based on inaccurate data.
 |
When you spot an artifact, you’ll have to decide whether to toss out the data completely or use whatever part of the test is accurate (if any). If a bad test result isn’t discovered until the scan is reviewed by the doctor, going back to redo the test in a busy clinic may not be practical. Also, depending on the cause of the artifact—a cataract, for example—redoing the test might not correct the problem. However, you can make that call based on the individual situation. The main issue is to always look over the entire printout, so you don’t fail to notice when part or all of the data is bad.
• Be on the alert for a discrepancy between the patient’s condition and what the machine says. Sometimes your knowledge of the patient’s condition may reveal the problem. For example, you may know the patient has advanced disease, but the machine shows all green, indicating healthy tissue. You should be doubly suspicious of an error in a situation like this. If the patient can’t even see the eye chart, but the scan says the tissue is thick and healthy, that’s a clear warning sign. If you look at the actual scan, you’ll almost certainly find the reason the value doesn’t make sense.
• Train your technicians to look for major artifacts. All of these artifacts are things the doctor should know about and be looking for, but some of them—as noted earlier—can also be spotted by a well-trained technician, increasing the odds that bad data won’t fall through the cracks. Catching a problem when the test is being conducted will save time and possibly prevent the doctor from making a bad treatment decision later. Even if the artifact is the result of technician error, the doctor is still ultimately responsible for making the right treatment decisions.
• Never make a diagnosis based on a single test. Given the reality that any test can have artifacts, it’s never a good idea to base your clinical choices on the results of a single test. Instead, perform multiple tests and consider their results as a whole. All of the tests should generally point in the same direction; if there’s an outlier in one of the tests, that test may have an artifact. REVIEW
Dr. Chen is an associate professor of ophthalmology at the Harvard Medical School and is Chief Quality Officer for Ophthalmology at the Massachusetts Eye and Ear Infirmary. She is on the full-time staff of the Massachusetts Eye and Ear Infirmary Glaucoma Service. She has no financial interest in any of the products mentioned in this article.
1. Liu Y, Simavli H, Que J, et al. Patient characteristics associated with artifacts in Spectralis optical coherence tomography imaging of the retinal nerve fiber layer in glaucoma. Am J Ophthalmol 2015;159:565-576.
2. Mansberger SL, Menda SA, Fortune BA, et al. Automated segmentation errors when using optical coherence tomography to measure retinal nerve fiber layer thickness in glaucoma. Am J Ophthalmol 2017;174:1-8.
3. Seibold LK, Mandava N, Kahook MY. Comparison of retinal nerve fiber layer thickness in normal eyes using time-domain and spectral-domain optical coherence tomography. Am J Ophthalmol 2010;150:807-14.


