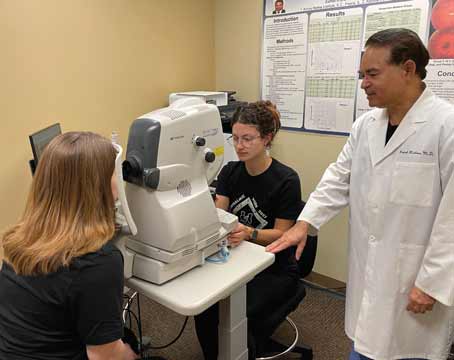
Visual field analysis, along with stereo photos of the optic disk, comprise the gold standard for detecting progression in glaucoma. However, many physicians would like the process to be a little more objective. To this end, Carl Zeiss Meditec recently received 510k approval to market a software program called the Visual Field Index on its Humphrey Visual Field Analyzer, which may allow clinicians to get a more objective impression of progression. Here's a look at VFI, and how it compares to another after-market field analyzer that's been around a bit longer, the Progressor program.
The VFI takes its place alongside the Field Analyzer's Glaucoma Progression Analysis tool, which analyzes the pattern deviation of a series of visual fields in an effort to determine if a patient's glaucoma is getting worse. Another analytic index the Field Analyzer provides is the pattern standard deviation, which is intended to give the user an idea of a subject's localized loss of vision. If the PSD is high, it may indicate loss in discrete areas, which could be a sign of glaucoma. The VFI, on the other hand, represents the percentage of useful vision a patient has left. The GPA is an event-based analysis, which, according to
"The problem with event-based analysis is that sometimes things can get messy," says Dr. Reynolds. "The visual field can be inconsistent since the patient may not be very good at taking it or it may be inherently variable, and this can lead to false positive results. VFI is a trend-based analysis. It looks at the global visual field and attempts to notify you whether or not, based on statistical analysis of this series of fields, the glaucoma is getting worse. With VFI, the software designers weighted the central parts of the visual field more, which may make it a better tool in terms of clinical usefulness."
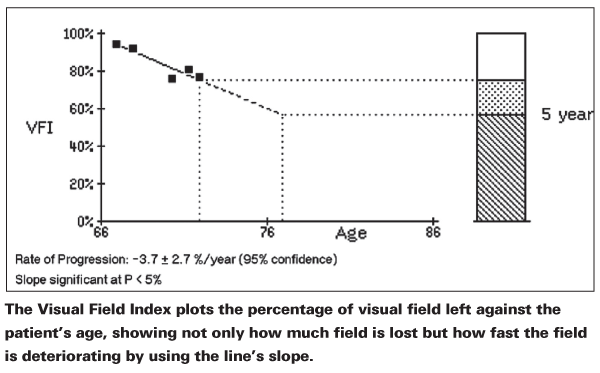
At the heart of this potential clinical usefulness, says Dr. Reynolds, is the fact that VFI takes the patient's age and the "velocity" of the change in visual field into account. It graphs the change on one axis and the patient's age on the other and demonstrates the slope of the line. He says this can help determine if the progression is truly an issue for a particular patient. "For instance, say you have two patients, one is 75 and the other is 65, and the 75-year-old has a worse-looking visual field, though his PSD is similar to the 65-year-old's. However, the slope of the progression line on the VFI is shallow in the 75-year-old, but much steeper in his younger counterpart. The 75-year-old's progression may not necessarily be something to worry about, but it's more likely that the rate of progression in the 65-year-old isn't acceptable. The difference isn't that they progressed—it's the rate of the progression relative to their age." Dr. Reynold's says this approach to analyzing progression is helpful because there's not a lot of interpretation involved. "You're looking at the slope of the line," he says. "It may be more clinically relevant than an event-based approach, because you don't have to interpret whether certain points of the progression of the visual field are important."
Angelo Tanna, MD, of
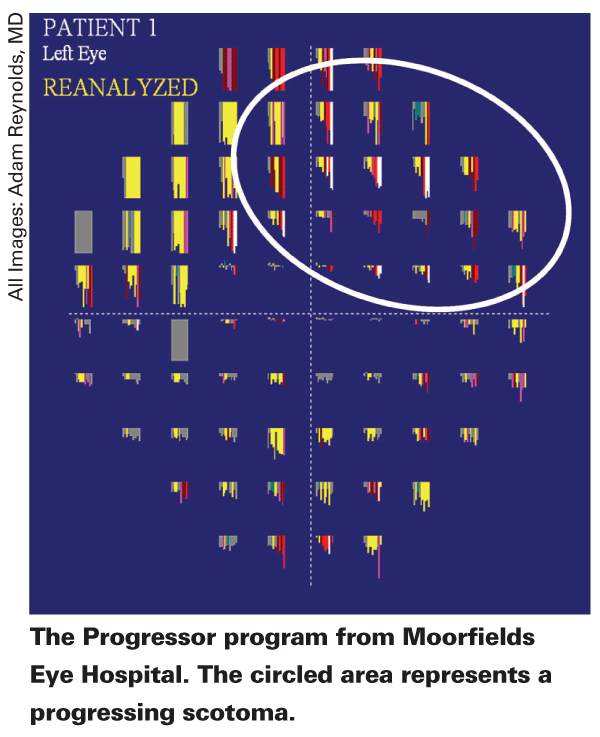
The VFI operates in a way similar to the Progressor program, which was developed at Moorfield's
"The nice thing about Progressor is that it's a hybrid of trend- and event-based analysis," says Dr. Reynolds. "It creates a graphical slope for each point of the visual field. It gives a much higher-resolution view of the visual field that you can look at globally, as well as focus in on a particular point of the field and see how fast it's getting worse at that point."
Though analyzing a Progressor image based on a series of visual fields can take more interpretation than simply looking at the VFI's slope, Dr. Reynolds says the high-resolution output may be a good "tiebreaker" in some cases. "For instance, when you show a patient's GPA to a group of experts, they can quibble sometimes," he says. "But when you take the same series of visual fields and analyze them with the Progressor, it can separate out who's getting worse from who isn't, and the experts are much more likely to agree on it." The disadvantage, however, says Dr. Reynolds, is that the clinician or researcher using Progressor probably needs more than six or seven exams to really make the program show you what it's capable of showing. "For the VFI, you really only need three visual fields, but you won't get great detail on the slope," he says. "You probably could start making a valid clinical judgment using the VFI with five or six fields."
The main challenge with using Progressor, and which some say makes it more useful to researchers than to a busy clinician, is that a user has to load the visual fields into the program one at a time from the perimeter.
Among clinicians in practice, subjective assessment of visual fields appears to be the most commonly utilized approach to detect progression. "However," notes, Dr. Tanna,
"even in patients with stable glaucoma, there is substantial variability in threshold sensitivity. It is impossible for the clinician to know the magnitude of change that represents clinically meaningful deterioration because the magnitude of normal fluctuation depends on the location in the visual field and the baseline degree of damage.
"Visual field data, however," he continues, "are amenable to computerized statistical analysis, and although each of the computerized methods may have some shortcomings, I believe those methods have great potential to help clinicians more accurately detect visual field progression in their patients with glaucoma."