OCT is currently the most precise, most sensitive test to identify abnormalities in the eye and their progression over time. “Back in the 1980s, when Goldmann visual field was the best test available, glaucoma was defined either as a pressure of higher than 21 mmHg or as a Goldmann visual field abnormality,” says Joel Schuman, MD, who practices at the University of Pittsburgh Medical Center. “Then, automated perimetry was introduced and became widely available, and many people who didn’t have Goldmann visual field abnormalities suddenly had visual field abnormalities on automated perimetry because it is the more sensitive test. Now, OCT is able to identify abnormalities and progression that were not identified using automated perimetry because OCT is a more sensitive test. It’s more precise, it’s more accurate and it’s more sensitive. The sensitivity and the precision allow us to detect early disease.”
The OCT Advantage
According to Sanjay Asrani, MD, OCT provides an optical cross-section of the optic nerve and the structures around it. “It is able to provide objective measurements of these structures in a precise manner that is not possible with other instruments, such as the GDx or the HRT, which provide an estimate of tissue thickness and not an exact measurement,” says Dr. Asrani, who is a professor of ophthalmology at Duke University, Durham, NC.
|
A study conducted by Dr. Schuman and colleagues sought to determine the retinal nerve fiber layer thickness at which visual field damage becomes detectable and associated with structural loss, and they found that substantial structural loss (approximately 17 percent) is necessary for functional loss to be detectable using current testing methods.1 The study included 72 healthy subjects and 40 glaucoma patients. All patients had visual field examinations and spectral domain OCT optic disc cube scans with the Humphrey field analyzer and Cirrus HD-OCT. The mean RNFL thickness threshold for visual field loss was 75.2 µm, which corresponded to a 17.3 percent RNFL thickness loss from the age-matched normative value. The slope for RNFL thickness and threshold value was 0.03 dB/µm above the tipping point and 0.28 dB/µm below the tipping point. The difference between the slopes was statistically significant. Quadrant and clock-hour analysis demonstrated similar patterns.
“Generally, if a patient has a clear abnormality, for example, a focal thinning of the nerve fiber layer, and there is a matching abnormality in the retina on the macular scan, but the visual field is still normal and the pressure is normal, I would probably monitor him or her to see if there is progression. However, if that same patient has a pressure of 25 or 26, I would probably start treatment,” Dr. Schuman says.
If a patient is identified by OCT as having some structural damage, Dr. Asrani typically follows him every six months with OCT to look for progression. If he doesn’t see progression, then he will push the next follow-up out to a year or more, and if he sees progression in the same location, he may initiate treatment depending on how extensive the damage is.
How It Works
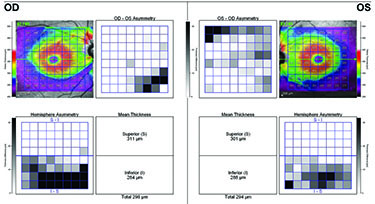
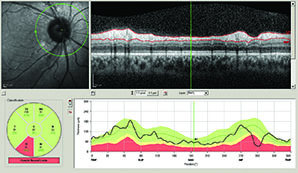
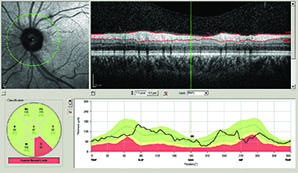
OCT compares an individual patient’s measurements to a normative database so ophthalmologists can see if the patient falls into the abnormal or borderline area. However, Dr. Asrani notes that OCT also compares measurements between a patient’s two eyes, which is important because asymmetry is a hallmark of glaucoma. “Some patients, especially myopic patients, can fall outside the normative database measurements,” he says. “In these cases, it is helpful to compare one eye to the other and look for asymmetry. Asymmetry, especially in the supero- or infero-temporal regions, provides a clue that it could be early glaucoma. In clinical practice, I examine two structures to detect early glaucoma: nerve fiber layer and macular thickness, which is a surrogate for ganglion cell layer thickness. When I see tissue losses in either of these structures that are in an arc shape, I am ready to believe that it could be due to early glaucoma.”
Dr. Asrani and colleagues modified the software protocols for detailed retinal thickness measurement by SD-OCT and applied it for diagnosis at different stages of glaucoma.2 Using the Spectralis SD-OCT, they customized the retinal thickness protocol to acquire detailed retinal thickness measurements of the central 20 degrees of the posterior pole. These customized maps are displayed in a compressed color scale that reveals small losses in retinal thickness. A novel asymmetry analysis protocol was created to highlight differences between the eyes and the two hemispheres within each eye. He found that this strategy shows promise in the diagnosis and management of glaucoma.
In a separate study, Dr. Asrani studied the artifacts of OCT in glaucoma.3 “When artifacts are present, it can confuse us into thinking that there is glaucoma when there is not, or vice versa,” he explains.
In this study, he found that Spectralis SD-OCT-related imaging artifacts likely occur in 15.2 percent to 36.1 percent of scans obtained in patients being evaluated for glaucoma. Some of these artifacts may not be evident on the final printout. “Physicians should be alert to the possibility of artifacts, particularly in patients with ocular pathologic features, such as an epiretinal membrane,” he says.
In this retrospective, cross-sectional study of 277 patients, 131 macular thickness scans were obtained, and 277 retinal nerve fiber layer scans were obtained. Of the macular thickness scans, 37 (28.2 percent) had imaging artifacts, and six of these artifacts were not obvious on the final printout. Of the RNFL scans, 55 (19.9 percent) contained artifacts, and seven of these artifacts were not evident on the final printout. The most common cause of artifacts for macular thickness and RNFL scans was ocular pathologic features, primarily the presence of an epiretinal membrane.
Dr. Asrani also notes that structural loss is not necessarily glaucoma. Any structural abnormalities need to be followed over time and assessed for progression of loss. “Once we detect ongoing change, we know it is glaucoma, and then we can start treating it, especially in patients who have normal intraocular pressure measurement and visual fields,” he says.
New Capabilities
SD-OCT offers several benefits in glaucoma assessment over the earlier-generation time-domain OCT, such as increased axial resolution and faster scanning speeds. Additionally, it has been shown to have improved reproducibility, but similar diagnostic accuracy. SD-OCT’s capabilities are quickly advancing with 3D imaging, reproducible registration, and advanced segmentation algorithms of the macular and optic nerve head regions of the eye.
For example, recently a group of researchers found that a new 3D SD-OCT analysis technique performed at least as well as the conventional circumpapillary RNFL in glaucoma discrimination and was even better at glaucoma suspect discrimination.4 This new method has the potential to improve early detection of glaucomatous damage.
The study included 192 eyes of 96 patients (44 healthy, 59 glaucoma suspect, and 89 glaucomatous eyes), which were scanned with SD-OCT. Each SD-OCT cube dataset was first converted into a 2D feature map based on RNFL segmentation and was then divided into various numbers of super pixels. The conventional super pixel has a fixed number of points, while the newly developed super pixel is defined as a cluster of homogeneous adjacent pixels with variable size, shape and number.
To automatically identify eyes with glaucoma, features of the super pixel map were extracted and were used as inputs to the machine classifier (LogitBoost adaptive boosting). To discriminate performance assessment, the area under the curve (AUC) of the receiver operating characteristics of the machine classifier outputs were compared with the conventional cpRNFL thickness measurements.
The researchers found that there was a statistically significantly higher AUC in the super pixel analysis than in the cpRNFL (0.855 vs. 0.707, respectively) when glaucoma suspects were discriminated from healthy individuals, while no significant difference was found when confirmed glaucoma eyes were discriminated from healthy eyes.
Additionally, a recent observational, cross-sectional study found that combining structural measurements of macular ganglion cell complex, peripapillary NFL and disc variables from Fourier-domain optical coherence tomography created a glaucoma structural diagnostic index (GSDI) that improved the accuracy for glaucoma diagnosis.5 In this study, GCC and NFL of healthy and perimetrical glaucoma subjects were mapped with the RTVue FD-OCT. Global loss volume and focal loss volume parameters were defined using NFL and GCC normative reference maps, and optimal weights for NFL, GCC and disc variables were combined using multivariate logistic regression to build the GSDI. Glaucoma severity was classified using the Enhanced Glaucoma Staging System. Diagnostic accuracy was assessed by sensitivity, specificity and the AUC.
| ||||||
Another study found that the clinical use of an OCT linear discriminant function (LDF) had better diagnostic ability for differentiating between healthy eyes and eyes with early glaucoma than individual OCT parameters.6 The LDF was based on retinal nerve fiber layer and ganglion cell-inner plexiform layer thickness measurements obtained using Cirrus HD-OCT. The study included 214 healthy individuals and 152 patients with glaucoma (teaching set) and another independent sample of 86 healthy individuals and 71 patients with glaucoma (validating set). Each patient had a macular scan and a peripapillary RNFL scan. Using binary logistic regression analysis, the linear discriminant function was calculated on the teaching set. Then, in the validating set of patients, receiver operating characteristic curves were plotted and compared between the OCT-provided parameters and the linear discriminant function.
The proposed LDF was 16.529-(0.132×superior RNFL)-(0.064×inferior RNFL)+(0.039×12 o’clock RNFL)+(0.038×1 o’clock RNFL)+(0.084×superior GCIPL)-(0.144×minimum GCIPL). In the validating set of patients, the LDF showed significantly higher area under the receiver operating characteristic curve than the best RNFL (inferior RNFL=0.91) and GCIPL parameter (minimum GCIPL=0.88). Additionally, the LDF yielded a sensitivity of 93.0 percent at a fixed specificity of 85.0 percent.
OCT Use in Screening
According to Dr. Schuman, OCT is a good tool for screening, but the yield is low in the general population. “Most people fall in the normal range,” he says. “So, if you are screening the general population, the yield will be low, and the patients whom you pick up as being abnormal or suspicious during a screening are not typically easy to get to a doctor’s office for follow-up. However, if you are conducting a screening, in my opinion, OCT is the best tool that we have.”
1. Wollstein G, Kagemann L, Bilonick RA, et al. Retinal nerve fibre layer and visual function loss in glaucoma: The tipping point. Br J Ophthalmol 2012;96(1):47-52.
2. Asrani S, Rosdahl JA, Allingham RR. Novel software strategy for glaucoma diagnosis: Asymmetry analysis of retinal thickness. Arch Ophthalmol 2011:129:1205-1211.
3. Asrani S, Essaid L, Alder BD, Santiago-Turla C. Artifacts in spectral-domain optical coherence tomography measurements in glaucoma. JAMA Ophthalmol Published online February 13, 2014.
4. Xu J, Ishikawa H, Wollstein G, et al. Three-dimensional spectral-domain optical coherence tomography data analysis for glaucoma detection. PLoS One. 2013;8(2):e55476.
5. Loewen NA, Zhang X, Tan O, et al; Advanced Imaging for Glaucoma Study Group. Combining measurements from three anatomical areas for glaucoma diagnosis using Fourier-domain optical coherence tomography. Br J Ophthalmol 2015 [Epub ahead of print].
6. Choi YJ, Jeoung JW, Park KH, Kim DM. Clinical use of an optical coherence tomography linear discriminant function for differentiating glaucoma from normal eyes. J Glaucoma 2015 [Epub ahead of print].