Here, three experts discuss their recent findings and thoughts on what clinical protocols make the most sense in light of our current understanding.
Does Fluctuation Matter?
One of the first questions that arises when considering fluctuating pressure inside the eye is: How much negative effect does fluctuating pressure have on the health of the eye—if any? The discussion is complicated by the fact that fluctuation can be seen as taking place over different time scales; very short-term, high-frequency fluctuations; diurnal fluctuation over the course of a day; and long-term fluctuation over months or years. Furthermore, most human IOP measurements are “snapshot” measurements—a single reading taken periodically in a doctor’s office. Any conclusions about the nature and impact of fluctuation have therefore been largely based on very sketchy evidence. Thanks to advances in technology, that’s beginning to change.
Ironically, the evidence regarding the impact of diurnal and long-term fluctuation is mixed. Data from some large studies suggests that fluctuation can be harmful and can contribute to the development and/or progression of glaucoma—but similar data from other studies seems to indicate the opposite.
Regarding this mixed evidence, Tony Realini, MD, associate professor of ophthalmology at West Virginia University Eye Institute in Morgantown, W.V., suspects there is, indeed, a connection. “If I do three visual fields on a patient and two are abnormal and one is normal—and the two that are abnormal are abnormal in the same spot—I tend to think that there’s something going on in that spot, even if it doesn’t show up every time,” he says. “Likewise, if an association appears in half or more of the studies, I think it’s reasonable to conclude that there’s probably something to it. The fact that the data doesn’t show it every time doesn’t mean it isn’t real.”
Ironically, Dr. Realini notes that if IOP fluctuation is eventually proven to contribute to glaucoma progression, that will create a clinical dilemma. “How are we going to assess that variability?” he asks. “This will require a lot of measurements at a lot of different times, which is expensive and time-consuming. Hopefully, we’ll soon have effective home tonometry so patients can take their own pressures, and a contact lens pressure monitor such as the Triggerfish may eventually help us with this. But right now it’s a twofold problem. Number one, what does it mean? And number two, if it’s important, how do we incorporate it into clinical practice?”
 How Much Does IOP Fluctuate?
A key part of solving the mystery of fluctuation’s impact is discovering exactly how much IOP actually fluctuates, and what patterns those fluctuations follow—if any. New tools under development may eventually enable us to monitor human IOP continuously, but in the meantime recent advances have allowed continuous monitoring of IOP in monkeys. That data is revealing some surprising things.
Bioengineer J. Crawford Downs, PhD, associate scientist and research director of the Ocular Biomechanics Laboratory at Devers Eye Institute in Portland, Ore., specializes in the study of the mechanics of intraocular pressure, particularly as it relates to the pathogenesis of glaucoma. He has conducted research on this issue with Claude F. Burgoyne, MD, at Devers, using the primate experimental glaucoma model, as well as with Christopher A. Girkin, MD, head of the glaucoma service at the University of Alabama at Birmingham, in human subjects.
Dr. Downs and his collaborators have become very interested in uncovering what is happening with IOP on a second-to-second time scale (i.e., high-frequency fluctuation). His current project with Dr. Burgoyne is designed to shed light on how the optic nerve head reacts to IOP and what may make people more or less susceptible to the various levels of IOP and its fluctuations. “I think people have assumed that IOP is fairly stable,” he says. “That’s partly because until recently, detailed studies of continuous IOP have been few and far between.
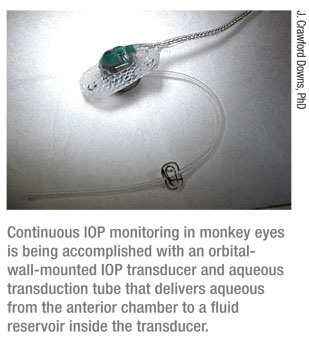
“We’re currently using a telemetry system we developed under an National Institute of Health grant that allows us to monitor IOP continuously in the eyes of unrestrained monkeys,” he explains. “This system transmits data up to 2,000 times per second, 24 hours a day. It’s a fully encapsulated implant system that can be used to simultaneously monitor different functions such as IOP, movement, body temperature, arterial blood pressure and electrocardiography. In this case, the IOP transducer is implanted in the orbital wall with a tiny silicone tube protruding into the anterior chamber (See picture, right); the transmitter is implanted in the abdomen of the animal underneath the musculature. It transmits continuously to an antenna that’s typically somewhere in the animal’s cage.
“Originally, our intention was to better understand IOP as an input for our biomechanical models of the optic nerve head and scleral shell in experimental glaucoma,” he continues. “But what got our attention was that IOP is incredibly dynamic. It’s moving all over the place—up to 45-mmHg swings in the course of a few minutes, especially if an animal is stressed.
“For example, if I walk into the room and an animal doesn’t know me very well, his IOP may go from 11 to 55 mmHg,” he says. “Every time our animals blink, their IOP goes up about 10 mmHg; every time they move their eyes—standard saccadic movements like those we all make all day, every day—IOP goes up 4 or 5 mmHg. We also have IOP data taken during Tonopen measurements of the animals’ pressure [which require touching the eye]. Those measurements, performed by Dr. Burgoyne, generated IOP spikes 12 to 25 mmHg above baseline. Furthermore, any time we turn the lights off, or there’s a loud noise, the animals’ IOP spikes—which means that outside stressors or environmental factors really affect the animals’ IOP. We videoed the animals during these events, and they were not rubbing their eyes or squinting or doing anything else that would cause these pressure spikes.”
 Dr. Downs says that overall, the amount of IOP variation they are finding is striking. “At 2:00 p.m. an animal could be at 11 mmHg; at 3:00 he’s at 17 mmHg,” he notes. “In any 24-hour period the swing was over a 15-mmHg range—and that’s after averaging out the high-frequency fluctuations, which can be huge.”
 |
“Originally, our intention was to better understand IOP as an input for our biomechanical models of the optic nerve head and scleral shell in experimental glaucoma,” he continues. “But what got our attention was that IOP is incredibly dynamic. It’s moving all over the place—up to 45-mmHg swings in the course of a few minutes, especially if an animal is stressed.
“For example, if I walk into the room and an animal doesn’t know me very well, his IOP may go from 11 to 55 mmHg,” he says. “Every time our animals blink, their IOP goes up about 10 mmHg; every time they move their eyes—standard saccadic movements like those we all make all day, every day—IOP goes up 4 or 5 mmHg. We also have IOP data taken during Tonopen measurements of the animals’ pressure [which require touching the eye]. Those measurements, performed by Dr. Burgoyne, generated IOP spikes 12 to 25 mmHg above baseline. Furthermore, any time we turn the lights off, or there’s a loud noise, the animals’ IOP spikes—which means that outside stressors or environmental factors really affect the animals’ IOP. We videoed the animals during these events, and they were not rubbing their eyes or squinting or doing anything else that would cause these pressure spikes.”
Dr. Downs says that overall, the amount of IOP variation they are finding is striking. “At 2:00 p.m. an animal could be at 11 mmHg; at 3:00 he’s at 17 mmHg,” he notes. “In any 24-hour period the swing was over a 15-mmHg range—and that’s after averaging out the high-frequency fluctuations, which can be huge.”
Dr. Downs notes that he and Dr. Burgoyne were not expecting these findings. “For years Dr. Burgoyne assumed that he was getting a reasonable estimate of an animal’s IOP by measuring pressure once a week using applanation tonometry,” he says. “Based on our recent data, we are coming to believe that this may be inadequate. Although snapshot tonometry remains the best way to characterize IOP noninvasively, at this point I don’t think we really understand what’s going on with IOP in either primates or humans. At the least, these data suggest that getting a meaningful idea of a patient’s IOP by measuring it in the clinic once every three or six months is impossible.”
Dr. Downs adds that they have found no evidence of a circadian rhythm, at least in the three monkeys they’ve studied 24 hours a day. “That cycle doesn’t seem to exist,” he says. “Perhaps such a cycle exists in humans because we sleep lying down, which by itself causes IOP to rise. Monkeys sleep sitting up.”
What About Humans?
Is there evidence that these numbers really do parallel what’s happening in human eyes? Dr. Downs notes that an early study by D. Jackson Coleman, MD, and Stephen Trokel, MD, provided some directly measured human data.1 “They cannulated an eye and did direct measurement of pressure in an awake patient,” he says. “The subjects blinked, squinted and rubbed their eyes. Their data suggests that blinking generates about 10 to 20 mmHg of brief pressure elevation; a forced squint raised an IOP of about 15 to 80 mmHg; and eye rubbing raised the pressure as high as 120 to 150 mmHg.
“The measurements that we found for fluctuation magnitudes in our primates were not as large as that,” he continues. “For example, when the monkeys blink, we see about a 10-mmHg increase, not 20 mmHg. Given this comparison, it’s possible that fluctuations in human eyes could be even larger than the kinds of fluctuation we’re seeing in monkey eyes.”
Luckily, the impact of high-frequency fluctuations may be less serious than the impact of longer-term fluctuations. Like Dr. Downs, Sanjay G. Asrani, MD, associate professor of ophthalmology at the Glaucoma Service of Duke Eye Center in Durham, N.C., has worked with around-the-clock pressure monitoring in animals. “Intraocular pressure in the animals fluctuates all the time,” he agrees. “But that happens to us as well. We rub our eyes, we cough and sneeze.
“However,” he continues, “animal studies have also shown that these small-duration pressure changes aren’t likely to impact the outcome of glaucoma.2 Stressing ganglion cells in the retina for a few minutes at a time doesn’t seem to affect the ability of the cells to recover. On the other hand, if the cells are pressured for an hour or two, their recovery of function is impeded. And this makes sense. Rubbing your eyes doesn’t lead to glaucoma; nor does having blepharospasms or frequent violent coughing. Short-duration fluctuations don’t seem to impact the eye the way longer-term fluctuations may.”
Dr. Asrani notes that increased IOP as a result of lying down to sleep for eight hours might be considered a longer-term IOP increase. “However, you have to remember that the lamina cribrosa, which is the junction between the eye fluids and the brain fluids, is affected by the pressure on both sides,” he says. “If your eye pressure goes up from lying down, so does your intracranial pressure, and that change might be counterbalancing the increase in intraocular pressure. It’s like scuba diving; if both pressures didn’t rise, your optic nerve would be wiped out.” Dr. Asrani adds that if this pressure compensation is real, it might undercut the potential impact of a nocturnal rise in pressure—or at least whatever part of such an increase could be attributed to the change in position from sitting up to lying down.
Are Fluctuation Patterns Consistent?
Because attempts to measure fluctuation are currently based on snapshot IOP measurements, extrapolation is required in order to draw any conclusions. That necessitates making certain assumptions about patterns that fluctuation follows, and recent data is casting doubt on some of those assumptions.
“People do diurnal IOP testing for different reasons,” observes Dr. Realini. “One reason is to identify otherwise unidentified peaks of IOP. Is this a normal-tension or high-tension glaucoma patient who just doesn’t have high pressure very often? In that situation, we’re not so much interested in when the peak occurs; we’re interested in whether it occurs, and if so, what the peak number is.
“Diurnal IOP testing may also be done in the context of research such as drug studies,” he says. “In that situation we want to standardize the time of day at which we measure IOP after initiating therapy in order to minimize diurnal variability and try to isolate any therapeutic IOP reduction caused by the drug. In these situations, we’re interested in timing. What is the IOP at different times?”
In hopes of helping to answer some of these questions, Dr. Realini has completed several studies that measured the IOP cycle in glaucomatous and healthy patients.3,4 (He notes that his group studied a 12-hour cycle because its funding wasn’t sufficient to cover the expense of around-the-clock measurement.) “We’re looking at the repeatability of diurnal IOP patterns in healthy people and glaucoma patients,” he says. “We’re trying to establish whether there really is a sustained diurnal IOP curve that an eye follows day after day. And if that turns out not to be the case, we’d like to determine the clinical value of diurnal IOP testing on a single day. Does it tell us anything about diurnal IOP behavior on other days?”
 Dr. Realini says that two of their studies found very poor repeatability of the diurnal IOP curve shape in glaucoma patients. “There doesn’t appear to be a pattern on any given day that is the same as on other days,” he says. “This means that knowing your IOP at 10 a.m. one day may not tell you anything about your IOP at 10 a.m. on some other day. This could have ramifications for both clinicians and researchers who are trying to measure IOP at standardized times of day in an attempt to remove diurnal variability from the equation. In fact, another similar study presented at the Association for Research in Vision and Ophthalmology meeting this year found the same thing. [Arora T, et al. IOVS 2011;52:ARVO E-abstract 3446] So, the evidence is mounting that IOP patterns are not consistent from day to day in a given eye. Using a single-day diurnal IOP curve to characterize diurnal IOP variability is probably inadequate.”
Dr. Realini says that two of their studies found very poor repeatability of the diurnal IOP curve shape in glaucoma patients. “There doesn’t appear to be a pattern on any given day that is the same as on other days,” he says. “This means that knowing your IOP at 10 a.m. one day may not tell you anything about your IOP at 10 a.m. on some other day. This could have ramifications for both clinicians and researchers who are trying to measure IOP at standardized times of day in an attempt to remove diurnal variability from the equation. In fact, another similar study presented at the Association for Research in Vision and Ophthalmology meeting this year found the same thing. [Arora T, et al. IOVS 2011;52:ARVO E-abstract 3446] So, the evidence is mounting that IOP patterns are not consistent from day to day in a given eye. Using a single-day diurnal IOP curve to characterize diurnal IOP variability is probably inadequate.” Dr. Realini notes that the reasons for this are debatable. “Some might argue that it’s because of the disease process,” he says. “Others might argue that it’s because the patients are under treatment, and the schedule of medication and dosing and possible noncompliance with medications could screw up diurnal IOP patterns. However, the repeatability of the diurnal IOP curve in the healthy subjects was equally bad.”
Dr. Realini says they did everything they could in these studies to minimize sources of external IOP variability so they’d only be measuring biologic variability. “We measured IOP using Goldmann tonometry 8 a.m. to 8 p.m., every two hours. The same technician used the same tonometer and technique on each patient at every time point. Retrospective IOP studies are notoriously problematic because of variations in these factors, so we did our best to eliminate them.
“In another study we reported at the ARVO meeting this year, we looked at the summary statistics of the curve,” he continues. “The question we sought to answer in this study was: Are the mean IOP, trough IOP, peak IOP and range found on one 12-hour test the same as the numbers on another 12-hour test done a week, a month, six months or a year later? We looked at this in both normals and glaucoma patients.
“The results were mixed,” he says. “We found fair to good agreement of mean, peak and trough IOP in healthy and glaucoma patients over time—not excellent, but fair to good. However, the range of IOP showed uniformly poor agreement in a given eye from day to day, for both groups.”
What about studies that purport to measure IOP around the clock? Dr. Asrani notes that one problem with 24-hour pressure studies is that they’re conducted under artificial circumstances. “The patients are not in their home environment,” he points out. “When you do a diurnal study, you keep these patients in a sleep lab. You tell them, ‘Don’t drink coffee or alcohol, don’t do this or that. Don’t smoke. Sit in one place.’ That’s a very artificial environment that might not reveal normal pressure changes. Another problem is that we’re not really measuring sleep pressure because we wake patients up to take the measurements. And we know that when you wake someone up, IOP goes up—even in healthy individuals. So we haven’t really been measuring true sleep pressure.”
Aside from general problems relating to the value of an individual measurement, Dr. Downs observes that IOP rising in response to stress has implications for doctors’ offices. “The fact that our animals’ pressure responds so readily to stressors makes me think that ‘white-coat syndrome’—the idea that your blood pressure goes up when you go to the doctor—is probably a big deal in human glaucoma clinical care,” he says. “I’m sure many patients are nervous during their exams. Maybe they haven’t been as compliant with their medications as they know they should be; maybe they’re dreading finding out that they’ve lost a little more vision; maybe they’re afraid they’ll need surgery, or they can’t afford their copay. If stressors affect IOP, what does this mean for your in-office IOP measurement?”
Fluctuation: Aid to Diagnosis
Despite all of these caveats, one fact about fluctuation that most doctors seem to agree upon is that large fluctuations are a characteristic of glaucoma, giving it some diagnostic value. For example, Dr. Asrani finds that gathering information about a patient’s IOP fluctuation over time is useful as an indication of the patient’s disease status.
To get a sense of the extent of fluctuation, Dr Asrani has patients return several times over a period of months at different times of day. “IOP is affected by many factors, including stress and compliance,” he notes. “So, I ask the patient to come back on different days at different times of day for about two hours per visit, over the course of three to six months.
“For example,” he continues, “I might ask the patient to come in to be measured in the morning, say at 7:30, and then measure his pressure again at 8:30 and 9:30. A month or two later, he’ll come in in the afternoon and we’ll measure him at 2:30, 3:30 and 4:30. If a patient has very early glaucoma with minimal losses, we’ll just do a single check at each appointment. On the other hand, if a patient has advanced glaucoma, time is of the essence—so I may have him return to complete a series of multiple measurements within a few weeks.
 “The reason for multiple measurements at different times over a period of months is to see how great the range of fluctuation is between visits,” he explains. “Fluctuating a lot between visits is one of the hallmarks of glaucoma—including normal-tension glaucoma. In fact, one of the ways we determine that someone has NTG is that his pressures are not stable from visit to visit. We published an article about that last year.5
“Over the past 10 years, I’ve observed that this can be used to identify which borderline patients are at risk,” he continues. “If a person has a suspicious optic nerve but his pressure is always within 3 to 4 mmHg no matter when we measure it, that individual is not likely to develop the disease. On the other hand, the more advanced the stage of glaucoma, the more prevalent these fluctuations become. Some patients with a suspicious-looking optic nerve will measure 14 mmHg at one visit, 21 mmHg at the next visit, and 7 mmHg at the visit after that. I believe that reflects an unstable outflow facility, and we’ve learned that these individuals have a much more significant risk of developing glaucoma. Of course, this comes with the caveat that you have to have very reliable pressure readings, made with the same type of instrument at each visit.”
Dr. Asrani adds that the purpose of multiple readings at each visit is simply to feel confident that the measurement is accurate. “If I get just one reading, it’s one snapshot for two seconds; if I do it three times over a period of hours, I’m a little more sure of the ballpark in which the patient resides,” he says. “Usually the pressures on a single day stay within 2 mmHg over three measurements.”
Dr. Realini says that his group’s findings don’t necessarily nullify the value of finding broad fluctuation in a given patient, particularly when the patient is untreated. “I think it’s true that the range of IOP in untreated glaucoma is, on average, greater than the range of IOP in a similar group of healthy people,” he says. “Our findings simply suggest that the range on any given day is not the range you’d observe on another day. Range is one measure of IOP variability that a lot of clinicians probably use—maximum pressure minus minimum. But if it’s not reproducible over time, then its clinical value may be limited if you only measure it on one day.”
Managing Fluctuation
“All of this presents us with a clinical dilemma,” observes Dr. Realini. “Elevated IOP has been shown to be a risk factor for progression, and reduction has been shown to reduce that risk. Furthermore, IOP variability has been shown to be a risk factor for progression, and we have indirect evidence that reducing variability can reduce progression. The clinical management question is, can we do anything about fluctuation, and can we do it in a way that doesn’t compromise our primary objective, which is to lower IOP?”
Dr. Downs agrees that choosing glaucoma treatments that help to dampen fluctuations is an arguable premise. “Of course, whether or not it will help prevent progression is anybody’s guess,” he says. “I believe it will, but we don’t yet have the data to support that. I think you can reasonably say it’s not going to hurt the patient, especially if you’re choosing an FDA-approved drug that’s already in clinical use. If you get dampening of pressure fluctuations with no extra side effects, that seems like a win-win to me.”
Dr. Realini says his clinical approach is to try to address both mean IOP and fluctuation at the same time. “It’s well-established that prostaglandins lower both mean IOP and IOP variability over a 24-hour period,” he says. “That’s convenient, because they’re my first choice anyway. They work really well; they’re very safe, and they’re dosed once a day.
 |
“If we’ve gotten past those three options and we still need further IOP reduction, any additions short of surgery may lower IOP a little further, but they probably won’t impact IOP variability very much,” he notes. “Surgery, of course, lowers IOP and variability as effectively as anything else, if not more so.”
Dr. Asrani believes it’s worthwhile to dampen fluctuation if it’s present. “When I find that a patient’s IOP is fluctuating significantly from visit to visit, I assume that patient is likely to progress and treat accordingly,” he says. “If a patient on a single drop is still fluctuating, I either add a second drop or perform SLT, which has been shown to narrow the range of IOP fluctuation in both POAG patients and NTG patients.5,10
“If a patient has very little vision left and is fluctuating on maximum medical therapy, I perform surgery, because I know the patient will worsen if nothing is done,” he continues. “A well-functioning trabeculectomy has been shown to completely cancel IOP fluctuation—even eliminating the pressure change normally seen when we go from the sitting position to the supine position.”11-13
Just Beginning the Journey
Dr. Downs believes the latest data calls into question the validity of most of the work that’s been done on IOP fluctuation, whether the fluctuation is diurnal or over the long term. “I don’t think we really have any idea how human IOP fluctuates,” he says. “That might explain why the data from some of the big studies suggest a link between long-term IOP fluctuation and glaucomatous progression while other studies don’t show a connection. These data are generally based on measurements taken once every three to six months. Our data suggest that snapshots taken months apart tell us very little about what’s really happening to the patient’s IOP.
“To really prove the link between glaucoma and IOP fluctuation is going to be a pretty steep hill to climb,” Dr. Downs concludes. “But I think we have the tools to eventually do that.”
Clinically, Dr. Realini says the bottom line is that we don’t know for sure how important it is to reduce IOP variability. “However,” he says, “if you want to reduce fluctuation, it’s important to find a way to do it that doesn’t compromise your primary objective: lowering IOP. I always make sure that my treatment choices don’t sacrifice what we know to be valuable for what might be valuable. If you can get the best IOP reduction out there and other potential benefits as well, terrific. But you should not compromise the IOP reduction in order to get a secondary benefit.”
1. Coleman DJ, Trokel S. Direct-recorded intraocular pressure variations in a human subject. Arch Ophthalmol 1969;82:637–640.
2. He J, Bui B, Vingrys A. Effect of repeated IOP challenge on rat retinal function. IOVS 2008;49:3026-3034.
3. Realini T, Weinreb RN, Wisniewski S. Short-term repeatability of diurnal intraocular pressure patterns in glaucomatous individuals. Ophthalmology 2011;118:1:47-51.
4. Realini T, Weinreb RN, Wisniewski SR. Diurnal intraocular pressure patterns are not repeatable in the short term in healthy individuals. Ophthalmology 2010;117:9:1700-4.
5. El Mallah MK, Walsh MM, Stinnett SS, Asrani SG. Selective laser trabeculoplasty reduces mean IOP and IOP variation in normal tension glaucoma patients. Clin Ophthalmol 2010;4:889-93.
6. Liu JH, Medeiros FA, Slight JR, Weinreb RN. Comparing diurnal and nocturnal effects of brinzolamide and timolol on intraocular pressure in patients receiving latanoprost monotherapy. Ophthalmology 2009;116:3:449-54.
7. Liu JH, Kripke DF, Weinreb RN. Comparison of the nocturnal effects of once-daily timolol and latanoprost on intraocular pressure. Am J Ophthalmol 2004;138:3:389-95.
8. Liu JH, Medeiros FA, Slight JR, Weinreb RN. Diurnal and nocturnal effects of brimonidine monotherapy on intraocular pressure. Ophthalmology 2010;117:11:2075-9.
9. Lee AC, Mosaed S, Weinreb RN, Kripke DF, Liu JH. Effect of laser trabeculoplasty on nocturnal intraocular pressure in medically treated glaucoma patients. Ophthalmology 2007;114:4:666-70.
10. Prasad N, Murthy S, Dagianis JJ, Latina MA. A comparison of the intervisit intraocular pressure fluctuation after 180 and 360 degrees of selective laser trabeculoplasty (SLT) as a primary therapy in primary open angle glaucoma and ocular hypertension. J Glaucoma 2009;18:2:157-60.
11. Hirooka K, Takenaka H, Baba T, Takagishi M, Mizote M, Shiraga F. Effect of trabeculectomy on intraocular pressure fluctuation with postural change in eyes with open-angle glaucoma. J Glaucoma 2009;18:9:689-91.
12. Hong S, Seong GJ, Hong YJ. Long-term intraocular pressure fluctuation and progressive visual field deterioration in patients with glaucoma and low intraocular pressures after a triple procedure. Arch Ophthalmol 2007;125:8:1010-3.
13. Wilensky JT, Zeimer RC, Gieser DK, Kaplan BH. The effects of glaucoma filtering surgery on the variability of diurnal intraocular pressure. Trans Am Ophthalmol Soc 1994;92:377-81.
14. Girard MJA, Suh J-KF, Bottlang M, Burgoyne CF, Downs JC. Biomechanical changes in the sclera of monkey eyes exposed to chronic IOP elevations. Investigative Ophthalmology and Visual Science. First published on April 25, 2011 as doi: 10.1167/iovs.10-6927.
15. Asrani S, Zeimer R, Wilensky J, Gieser D, Vitale S, Lindenmuth K. Large diurnal fluctuations in intraocular pressure are an independent risk factor in patients with glaucoma. J Glaucoma 2000;9:2:134-42.


