Clinical Presentation & Exam
In the earliest stages of HCQ toxicity, patients are often asymptomatic with preservation of visual acuity. However, perceptive individuals may report difficulty with night vision, glare or paracentral scotomas that interfere with reading.4-6 The scotoma typically becomes apparent to the patient well before changes are seen on examination. While recognition of subtle foveal depigmentation has been described in some cases of early toxicity, this was only after corroboration with ancillary imaging studies.7
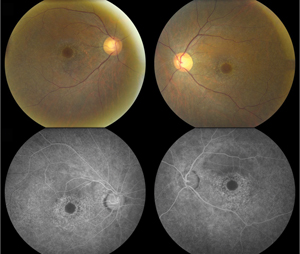
On the other hand, visible bull’s-eye retinopathy, characterized by a ring of retinal pigment epithelium degeneration often sparing the foveal center, is a late finding indicative of advanced damage (See Figure 1). Thus, ophthalmoscopy alone is not sufficient to screen for HCQ toxicity.7,8 That being said, a detailed anterior and posterior segment examination to assess for corneal verticillata as well as concurrent macular disease (i.e., age-related macular degeneration), remains important in monitoring these patients long term.
|
Screening Guidelines
In 2002, the AAO published its initial Preferred Practice Patterns for HCQ retinopathy screening in response to the diverse regimens being advocated at the time.9 These recommendations were revised in 2011 to reflect the increased sensitivity of newer diagnostic imaging techniques.4
If a patient was deemed a low risk for retinopathy, follow-up examinations were recommended beginning at five years of therapy after the initial baseline. If a patient was high risk, annual follow-up was recommended. High risk was defined as someone with duration of HCQ use more than five years, more than 1,000 grams of cumulative consumption, more than 6.5 mg/kg/d daily dosing, increased age (no cut-point specified), concomitant hepatic/renal disease or pre-existing maculopathy of another etiology.4
In addition to an ophthalmologic examination and automated threshold Humphrey visual field testing with a white 10-2 pattern (which should be interpreted with a low threshold for abnormality and with repeat testing if irregularities are noted), at least one of the following supplemental objective imaging studies is recommended: 1) spectral-domain optical coherence tomography; 2) fundus autofluorescence; or 3) multifocal electroretinography, at baseline and annually at each visit after five years of HCQ use.4 Notably absent, fluorescein angiography was not recommended in these guidelines. While FA can reveal the bull’s-eye pattern of granular hyperfluorescence and may be able to elucidate subtle RPE defects, it has not been proven to be as sensitive as the aforementioned tests and comes with added morbidity due to its invasiveness.4
Spectral-Domain OCT
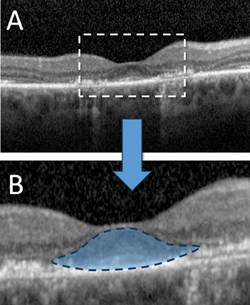
By generating high-resolution, cross-sectional images of the retina in vivo, SD-OCT may detect significant structural alterations prior to development of visible HCQ retinopathy. Previously described OCT findings in HCQ toxicity include loss of the external limiting membrane, disruption of the outer ellipsoid zone, parafoveal thinning of the outer nuclear layer and RPE damage.6,7,10 Despite these various changes, numerous studies have supported the notion that relative “foveal resistance” is common in HCQ toxicity, as demonstrated by preservation of the subfoveal outer retinal layers, accounting for the intact central visual acuity that can be seen even in advanced disease states.6 This foveal sparing serves as the basis for the “flying saucer” sign of HCQ retinopathy described by Eric Chen, MD, and colleagues, where an ovoid appearance is created by the intact central foveal outer retinal structures contrasting to the adjacent perifoveal loss of the photoreceptor ellipsoid band and ONL atrophy (See Figure 2).11
|
While much of the literature has focused on the changes to the outer retina in HCQ retinopathy, the earliest SD-OCT findings of toxicity may actually localize to the inner retina. Sirichai Pasadhika, MD, and colleagues observed selective thinning of the perifoveal inner retina on SD-OCT, especially the inner plexiform and ganglion cell layers, in patients treated with long-term HCQ (more than five years) in the absence of structural changes to the outer retinal/RPE or other clinically evident toxicity.12 Interestingly, thinning of the retinal nerve fiber layer was not found in these patients, which the authors proposed only happens once significant retinal ganglion cell degeneration has occurred. In a separate study designed to compare chronically treated patients with and without ophthalmoscopic evidence of toxicity, significant thinning of the inner, outer and full thickness retina was observed in patients with clinically apparent retinal toxicity, whereas only selective thinning of the inner retina was detected in the group without fundus changes.13 Once again, RNFL thinning was absent in patients with chronic HCQ exposure and no fundus changes; however, the group with fundus changes related to drug toxicity demonstrated peripapillary RNFL thinning. Recently, Ulviye Yigit and coauthors corroborated these findings by measuring significant thinning of the inner retina during HCQ therapy, especially in para- and perifoveal areas, in the absence of clinical fundus changes.14 Unique to their study was the inclusion of the patients receiving HCQ treatment for less than five years (average duration: 2.5 years).
More investigations involving larger numbers of patients need to be performed to better determine what SD-OCT-based indices may be reliably assessed in early HCQ toxicity. However, given its rapid image acquisition time, noninvasive nature and wide availability in many clinics, the majority of practitioners continue to favor SD-OCT as the primary adjunct to visual field testing in HCQ screening.
Fundus Autofluorescence
Imaging with FAF may help elucidate toxic alterations to the underlying RPE due to long-term HCQ therapy. An increased FAF signal typically indicates accumulation of lipofuscin, in particular the A2E fluorophore, within the RPE either from abnormal metabolism with increased phagocytosis of photoreceptor outer segments or an inherited/acquired defect of the phagocytotic processes.15,16 An extinguished FAF signal, on the other hand, indicates RPE cell death.17
The early finding of a pericentral ring of increased FAF intensity, appearing as a hyperfluorescent glow, may be seen in HCQ toxicity before RPE degeneration develops, and is thought to represent areas of early photoreceptor damage from accumulation of outer segment debris.4,18,19 However, this can be quite subtle and may be easily missed by the untrained reviewer. When observed, coexisting mfERG or SD-OCT abnormalities have also been concomitantly detected, suggesting a pathophysiologic basis for the FAF finding.7,18 Despite this, evidence supporting the usefulness of FAF in detecting early subclinical toxicity is still lacking overall, thus making it less reliable as a primary screening tool.
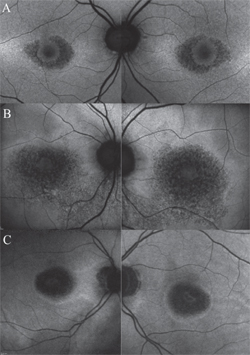
More important than screening, the true value of FAF lies in its capability to monitor progression in known cases of HCQ retinopathy, such as when a patient has been discontinued from the medication, but still requires periodic follow-up examinations. In this context, FAF provides a sensitive indicator of RPE degeneration as toxicity progresses, particularly in advanced stages. As the RPE atrophies, the FAF intensity in the pericentral macula changes to a mottled, or speckled appearance, and eventually coalesces into dark areas of absence of FAF signal once the cells have died (See Figure 3).
|
Multifocal Electroretinography
Traditional full-field electroretinography represents a test of global retinal function in response to photic stimulation. As it is not sensitive to functional changes localized to the macula, cases of HCQ toxicity would demonstrate abnormalities only after diffuse retinal damage has already occurred, limiting its utility in screening programs.4,9
Conversely, multifocal ERG, with its ability to record localized central retinal defects, has gained acceptance as an excellent candidate for detecting subtle changes in the early stages of toxicity.20 Raj Maturi, MD, and colleagues first reported a marked reduction in the central 16˚ mfERG amplitude in a patient with manifest HCQ retinopathy in the setting of a normal full-field ERG.21 Similar results have been obtained by subsequent studies characterizing HCQ users. Timothy Y.Y. Lai, MMedSc, MRCS, and colleagues observed a longitudinal decline in the retinal function of patients receiving long-term HCQ, and proposed that serial mfERG may help detect early retinal changes associated with toxicity.22 In a follow-up study, they showed that mfERG responses correlated with the HVF 10-2 mean deviation values, and thus could supplement visual field testing by providing an objective measurement of retinal function in patients using HCQ.23
The most specific waveform pattern seen in patients with HCQ toxicity is paracentral amplitude loss, indicative of decreased retinal function in the susceptible perifovea. In another study, Dr. Maturi and colleagues proposed that prolonged implicit time, when seen in conjunction with the paracentral loss of amplitude, may be a more specific feature of HCQ toxicity.24 Furthermore, they demonstrated three additional configurations, besides paracentral loss, of abnormal mfERG amplitude changes: 1) central foveal loss; 2) peripheral loss; and 3) generalized loss.24 Their system for classifying patterns of mfERG changes has since been corroborated by other groups.20,22
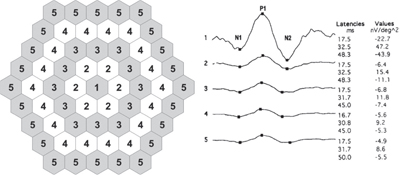
In an effort to increase the sensitivity over standard mfERG interpretation in detecting early HCQ toxicity, Jonathan S. Lyons, MD, and Matthew L. Severns, PhD, developed a novel algorithm for tabulating mfERG data, termed the “ring ratio method” (See Figure 4).20,25 Given that the amplitude of any single administered mfERG can vary by up to 30 percent from a subsequent testing,26 the ring ratio was designed to decrease this background noise and create more normative values to aid in clinical decision making. For this, the data from a 61-hexagon mfERG is structured into five zones of concentric rings (R1-R5).
|
While mfERG testing has shown great promise as an objective measure for detecting early HCQ toxicity as well as tracking the progression of macular changes in known disease, it is limited by its dependence on patient cooperation, specialized staff training for administration and interpretation, and overall cost. Perhaps most importantly, it is not as readily available or easy to reliably perform as SD-OCT or FAF, thus limiting its widespread use to date.
No Single ‘Best Test’
Despite the increased integration of these imaging systems into both research and clinical practice forums, there remains no consensus which test is the gold standard for detecting early HCQ toxicity. The discord is evident throughout the literature, as various proponents have argued in favor of visual fields, FAF, mfERG or SD-OCT as the most sensitive/specific method. In a recent retrospective, private-practice based study of 219 patients, David J. Browning, MD, PhD, concluded that the revised guidelines emphasizing ancillary FAF, SD-OCT or mfERG, have actually raised screening cost without improving case detection of toxicity.27
Meanwhile, others have suggested that certain patients may differ in their apparent sensitivity to different tests, and therefore careful screening with multiple modalities is likely to increase the diagnostic yield in detecting toxicity prior to the onset of irreversible structural/functional loss.7 Michael Marmor, MD, and Ronald Melles, MD, recently illustrated the need for this multifaceted approach in a subset of 11 patients representing 10 percent of their patients with known HCQ toxicity. This cohort demonstrated pathognomonic 10-2 field loss with prominent parafoveal ring scotomas that were strongly indicative of retinopathy; however, they did not display any evidence of structural damage on SD-OCT imaging.28 The authors emphasized the need to take a broad approach when dealing with HCQ screening, not to rely solely on any single procedure, and follow-up any equivocal results with additional confirmatory testing.
Future Directions
The advent of adaptive optics imaging has enabled visualization of the cone photoreceptor mosaic in vivo to resolutions of ≤ 2 µm by compensating for aberrations in ocular optics.29-31 Using this technology, photoreceptor abnormalities have been uncovered in various retinal diseases that were not otherwise discernible with SD-OCT imaging.32,33
The use of adaptive optics in HCQ retinopathy is relatively new. Kimberly E. Stepien, MD, and colleagues demonstrated disruption of the cone photoreceptor mosaic in areas corresponding to HVF 10-2 defects and SD-OCT ellipsoid zone abnormalities in two patients on long-term HCQ therapy.33 Similarly, Korean researchers observed a disrupted cone mosaic pattern with individual cones having irregular shapes and sizes in a patient with bull’s-eye maculopathy.34 Additionally, overall measured cone densities were diminished in all predetermined test points at various distances from the foveal center. Taken together, both groups proposed AO provides a non-invasive, quantitative, high-resolution modality for imaging HCQ retinopathy patients, and may allow detection of subclinical abnormalities that precede objective visual field loss. Larger scale studies are required to validate these findings.
Recently, two groups have described the use of microperimetry systems to evaluate for early HCQ toxicity.35,36 By testing perimetry under simultaneous fundus visualization, a precise anatomic correlate to a functional aberration can be obtained.35 Lucia Martinez-Costa and colleagues observed significant differences in microperimetry retinal sensitivity measurements between 209 patients taking either HCQ or chloroquine compared with 204 control subjects.36 Renu Jivrajka, MD, and colleagues detailed their findings in a cohort of 16 patients on HCQ therapy for more than five years with no signs of toxicity by conventional 10-2 HVF, SD-OCT, FAF or mfERG testing; however, with microperimetry they noted a significant overall reduction in mean retinal sensitivity between patients and age-similar controls.35 An additional advantage of the particular microperimetry system utilized was its ability to obtain simultaneous SD-OCT images and superimpose retinal sensitivity and thickness values, further reinforcing the notion of correlating functional response to an anatomic structure. Future prospective longitudinal studies are needed, with serial microperimetry testing, in order to better determine whether the reduced retinal sensitivities actually represent early subclinical HCQ toxicity.
Hydroxychloroquine is a valuable drug with an overall low side-effect profile. While ocular toxic effects are infrequent, they may be associated with significant and irreversible patient morbidity. Early detection of toxicity during subclinical stages with discontinuation of the medication may help prevent further structural and functional deterioration. As such, clinicians should maintain a low threshold for suspecting HCQ toxicity. Subtle abnormalities detected using one modality warrant additional follow-up testing to confirm or refute these findings, with the ultimate goal of early diagnosis before irreversible visual loss. REVIEW
Figure 4 reproduced with permission from: Lyons JS, Severns ML. Detection of early hydroxychloroquine retinal toxicity enhanced by ring ratio analysis of multifocal electroretinography. Am J Ophthalmol 2007. May;143(5):801-809.
Dr. Rahimy is a second-year fellow at Wills Eye Hospital and a clinical instructor of ophthalmology at Thomas Jefferson University School of Medicine. Dr. Vander is an attending surgeon of the Retina Service at Wills Eye Hospital and professor of ophthalmology at Thomas Jefferson University School of Medicine. Dr. Rahimy may be contacted at erahimy@gmail.com. Dr. Vander may be contacted at jvander@midatlantic retina.com.
1. Tehrani R, Ostrowski RA, Hariman R, Jay WM. Ocular toxicity of hydroxychloroquine. Semin Ophthalmol 2008;23(3):201-209.
2. Semmer AE, Lee MS, Harrison AR, Olsen TW. Hydroxychloroquine retinopathy screening. Br J Ophthalmol 2008;92(12): 1653-1655.
3. Wolfe F, Marmor MF. Rates and predictors of hydroxychloroquine retinal toxicity in patients with rheumatoid arthritis and systemic lupus erythematosus. Arthritis Care Res (Hoboken) 2010;62(6):775-784.
4. Marmor MF, Kellner U, Lai TY, Lyons JS, Mieler WF. Revised recommendations on screening for chloroquine and hydroxychloroquine retinopathy. Ophthalmology 2011;118:415-422.
5. Michaelides M, Stover NB, Francis PJ, Weleber RG. Retinal toxicity associated with hydroxychloroquine and chloroquine: Risk factors, screening, and progression despite cessation of therapy. Arch Ophthalmol 2011;129:30-39.
6. Mititelu M, Wong BJ, Brenner M, Bryar PJ, Jampol LM, Fawzi AA. Progression of hydroxychloroquine toxic effects after drug therapy cessation: New evidence from multimodal imaging. JAMA Ophthalmol 2013;131:1187-1197.
7. Marmor MF. Comparison of screening procedures in hydroxychloroquine toxicity. Arch Ophthalmol 2012;130:461-469.
8. Elder M, Rahman AM, McLay J. Early paracentral visual field loss in patients taking hydroxychloroquine. Arch Ophthalmol 2006;124:1729-1733.
9. Marmor MF, Carr RE, Easterbrook M, Farjo AA, Mieler WF. Recommendations on screening for chloroquine and hydroxychloroquine retinopathy: A report by the American Academy of Ophthalmology. Ophthalmology 2002;109:1377-1382.
10. Kellner S, Weinitz S, Kellner U. Spectral domain optical coherence tomography detects early stages of chloroquine retinopathy similar to multifocal electroretinography, fundus autofluorescence and near-infrared autofluorescence. Br J Ophthalmol 2009;93(11):1444-1447.
11. Chen E, Brown DM, Benz MS, et al. Spectral domain optical coherence tomography as an effective screening test for hydroxychloroquine retinopathy (the “flying saucer” sign). Clin Ophthalmol 2010;4:1151-1158.
12. Pasadhika S, Fishman GA, Choi D, Shahidi M. Selective thinning of the perifoveal inner retina as an early sign of hydroxychloroquine retinal toxicity. Eye (Lond) 2010;24(5):756-762; quiz 763.
13. Pasadhika S, Fishman GA. Effects of chronic exposure to hydroxychloroquine or chloroquine on inner retinal structures. Eye (Lond) 2010;24(2):340-346.
14. Ulviye Y, Betul T, Nur TH, Selda C. Spectral domain optical coherence tomography for early detection of retinal alterations in patients using hydroxychloroquine. Indian J Ophthalmol 2013;61(4):168-171.
15. Kennedy CJ, Rakoczy PE, Constable IJ. Lipofuscin of the retinal pigment epithelium: A review. Eye (Lond) 1995;9 ( Pt 6)):763-771.
16. Okubo A, Rosa RH, Jr., Bunce CV, et al. The relationships of age changes in retinal pigment epithelium and Bruch’s membrane. Invest Ophthalmol Vis Sci 1999;40(2):443-449.
17. Holz FG, Bellman C, Staudt S, Schutt F, Volcker HE. Fundus autofluorescence and development of geographic atrophy in age-related macular degeneration. Invest Ophthalmol Vis Sci 2001;42(5):1051-1056.
18. Kellner U, Renner AB, Tillack H. Fundus autofluorescence and mfERG for early detection of retinal alterations in patients using chloroquine/hydroxychloroquine. Invest Ophthalmol Vis Sci 2006;47(8):3531-3538.
19. Marmor MF. Fundus autofluorescence is not the best early screen for hydroxychloroquine toxicity. JAMA Ophthalmol 2013;131:1487-1488.
20. Lyons JS, Severns ML. Detection of early hydroxychloroquine retinal toxicity enhanced by ring ratio analysis of multifocal electroretinography. Am J Ophthalmol 2007;143:801-809.
21. Maturi RK, Folk JC, Nichols B, Oetting TT, Kardon RH. Hydroxychloroquine retinopathy. Arch Ophthalmol 1999;117:1262-1263.
22. Lai TY, Chan WM, Li H, Lai RY, Lam DS. Multifocal electroretinographic changes in patients receiving hydroxychloroquine therapy. Am J Ophthalmol 2005;140:794-807.
23. Lai TY, Ngai JW, Chan WM, Lam DS. Visual field and multifocal electroretinography and their correlations in patients on hydroxychloroquine therapy. Doc Ophthalmol 2006;112(3):177-187.
24. Maturi RK, Yu M, Weleber RG. Multifocal electroretinographic evaluation of long-term hydroxychloroquine users. Arch Ophthalmol 2004;122:973-981.
25. Lyons JS, Severns ML. Using multifocal ERG ring ratios to detect and follow Plaquenil retinal toxicity: a review : Review of mfERG ring ratios in Plaquenil toxicity. Doc Ophthalmol 2009;118(1):29-36.
26. Tzekov RT, Gerth C, Werner JS. Senescence of human multifocal electroretinogram components: A localized approach. Graefes Arch Clin Exp Ophthalmol 2004;242(7):549-560.
27. Browning DJ. Impact of the revised american academy of ophthalmology guidelines regarding hydroxychloroquine screening on actual practice. Am J Ophthalmol 2013;155:418-428.e411.
28. Marmor MF, Melles RB. Disparity between Visual Fields and Optical Coherence Tomography in Hydroxychloroquine Retinopathy. Ophthalmology 2014;121:1257-62.
29. Roorda A, Romero-Borja F, Donnelly Iii W, Queener H, Hebert T, Campbell M. Adaptive optics scanning laser ophthalmoscopy. Opt Express 2002;10(9):405-412.
30. Park SP, Chung JK, Greenstein V, Tsang SH, Chang S. A study of factors affecting the human cone photoreceptor density measured by adaptive optics scanning laser ophthalmoscope. Exp Eye Res 2013;108:1-9.
31. Kim JE, Chung M. Adaptive optics for retinal imaging: Current status. Retina 2013;33:1483-1486.
32. Carroll J, Neitz M, Hofer H, Neitz J, Williams DR. Functional photoreceptor loss revealed with adaptive optics: An alternate cause of color blindness. Proc Natl Acad Sci U S A 2004;101(22):8461-8466.
33. Stepien KE, Martinez WM, Dubis AM, Cooper RF, Dubra A, Carroll J. Subclinical photoreceptor disruption in response to severe head trauma. Arch Ophthalmol 2012;130:400-402.
34. Bae EJ, Kim KR, Tsang SH, Park SP, Chang S. Retinal damage in chloroquine maculopathy, revealed by high resolution imaging: A case report utilizing adaptive optics scanning laser ophthalmoscopy. Korean J Ophthalmol 2014;28(1):100-107.
35. Jivrajka RV, Genead MA, McAnany JJ, Chow CC, Mieler WF. Microperimetric sensitivity in patients on hydroxychloroquine (Plaquenil) therapy. Eye (Lond) 2013;27(9):1044-1052.
36. Martinez-Costa L, Victoria Ibanez M, Murcia-Bello C, et al. Use of microperimetry to evaluate hydroxychloroquine and chloroquine retinal toxicity. Can J Ophthalmol 2013;48(5):400-405.