|
The dominant sources are fluorophores such as A2-E in lipofuscin granules that accumulate in the postmitotic retinal pigment epithelium as a by-product of the incomplete degradation of photoreceptor outer segments.4,9,25 Additional in-trinsic fluorophores may occur with disease in the various retinal layers or the subneurosensory space. Minor fluorophores such as collagen and elastin in choroidal blood vessel walls may become visible in the absence or atrophy of RPE cells. Bleaching phenomena and loss of photopigment may result in increased FAF by reduced absorbance of the excitation light. Finally, pathological alterations in the inner retina at the central macula where the FAF signal is usually partially masked by luteal pigment (lutein and zeaxanthin) may result in manifest variations in FAF intensities.
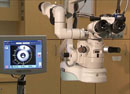
Recording of FAF is relatively easily accomplished, requires little time and is non-invasive. FAF signals are emitted across a broad spectrum ranging from 500 to 800 nm.4 With the confocal scanning laser ophthalmoscope , excitation is usually induced in the blue range (lambda=488 nm), and an emission filter between 500 and 700 nm is used to detect emission of the autofluorescence signal.12 Excitation when using the fundus camera is usually done in the green spectrum (535 to 580 nm) and emission is recorded in the yellow-orange spectrum (615 to 715 nm [according to the modifications by Richard Spaide24]). Because of the difference in excitation and emission spectra, in addition to technical differences between the cSLO and the fundus camera, theoretical considerations would imply that the composition of the detected autofluorescent signal may vary between the systems.
Detection of Early Disease and Phenotyping
FAF imaging may allow for identification of retinal diseases when these are not otherwise evident.
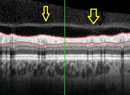
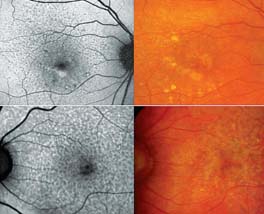
Metabolic changes at the level of the photoreceptor/RPE complex may not be visualized by fundus-copy or other routine imaging techniques such as fluorescein angiography in early manifestations of macular and retinal dystrophies. This is particularly helpful to investigate patients with unknown visual loss or a positive family history of hereditary retinal diseases.14,27 In early dry age-related macular degeneration, alterations at the level of the RPE may become visible in areas that appear normal on funduscopy. Reticular pseudodrusen as a particular phenotype are readily visible on FAF images (See Figure 2).
|

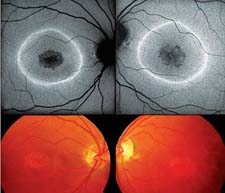
FAF imaging furthermore may help in diagnosing hereditary retinal disorders such as Stargardt's disease (See Figure 3), vitelliform macular and pattern dystrophies, and may be used for correlation with specific genetic defects.27
FAF Signal as a Predictive Marker
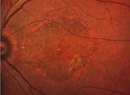
Several lines of evidence suggest that excessive lipofuscin accumulation represents a common downstream pathogenic pathway in various hereditary and complex retinal diseases.1,25 Clinical observations indicate different degrees and extension of levels of increased FAF that do not or only poorly correlate with findings obtained by other imaging techniques (See Figure 4). These FAF changes remote from visible alterations may suggest more widespread abnormalities and diseased retinal areas.2 Focally increased FAF, and therefore, excessive RPE lipofuscin load, may indicate dysfunctioning RPE cells. Indeed, the pathophysiological role of abnormal FAF is underscored by recent longitudinal studies. For example, it has been demonstrated that areas with increased FAF signal, that might reflect excessive RPE lipofuscin build-up, precede the development of new areas or the enlargement of pre-existing atrophic patches in geographic atrophy secondary to AMD.10 Furthermore, the extension of abnormal FAF as well as the previously introduced FAF pattern classification have an impact on atrophy enlargement rates over time and may therefore serve as predictive determinants.11,21,31
The identification of high-risk characteristics, i.e., clinical biomarkers, for disease progression may be helpful not only for monitoring patients with advanced atrophic AMD, but also for performing clinical interventional trials with "fast progressers." In patients with choroidal neovascularisation or in inflammatory diseases, FAF abnormalities typically extend beyond the angiographically visible alterations indicating also a more widespread disease.2,18,23,26 Changes in the FAF signal may permit to estimate the extent of damage, diagnose sequella such as secondary CNV, learn more about the inflammatory process, and possibly anticipate future problems caused by disease. One recent study indicates that FAF changes better correlated with visual acuity than symptoms length and lesion size.26 While early CNV typically manifested with patches of "continuous" or "normal" autofluorescence (corresponding with areas of hyperfluorescence on the comparative fluorescein angiograms), long-standing CNV exhibited more areas with decreased intensity. The latter observation was explained by photoreceptor loss and scar formation with increased melanin deposition. Of note, a decreased FAF signal does not necessarily mean irreversible retinal damage, as it might also be caused by subretinal fluid or hemorrhages. A possible predictive value of FAF imaging with regards to determination of therapeutic success by anti-VEG treatment has been demonstrated.7
In particular, the development of visual acuity is less favorable in eyes with initially increased central FAF.
|

Monitoring of Disease Progression
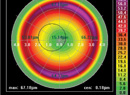
Due to the absence of RPE lipofuscin, atrophic areas such as in atrophic AMD or Stargardt's disease exhibit a markedly reduced signal. Such diseased areas and atrophic patches can be easily identified and, moreover, precisely quantified by customized image-analysis software.3,19 This allows for non-invasive monitoring of atrophy progression over time (See Figure 5).
Functional Correlation
The relevance of alterations in FAF images can further be addressed by assessing corresponding retinal sensitivity. In patients with geographic atrophy secondary to AMD, it has been shown that—in addition to absence of retinal sensitivity over atrophic areas—retinal function is relatively and significantly reduced over areas with increased FAF intensities compared to areas with normal background signal.20
Localized functional impairment over areas with increased FAF has been also recently confirmed in patients with early AMD. Using fine matrix mapping, it has been demonstrated that rod function is more severely affected than cone function over areas with increased FAF in patients with AMD.22 These studies are in accordance with the observation of increased accumulation of autofluorescent material at the level of the RPE prior to the occurrence of cell death. As normal photoreceptor function is dependent on normal RPE function, in particular with regard to the constant phagocytosis of shed distal outer segment stacks for photoreceptor cell renewal, a negative feedback mechanism has been proposed, whereby cells with lipofuscin-loaded secondary lysosomes would phagocytise less shed POS, subsequently leading to impaired retinal sensitivity. This would also be in line with experimental data showing that compounds of LF such as A2-E possess toxic properties and may interfere with normal RPE cell function via various molecular mechanisms, including impairment of lysosomal function.1
|
Future Therapeutic Applications
In patients with advanced atrophic AMD, FAF imaging may also be helpful to develop and assess new emerging therapeutic strategies. Visual cycle modulators, which aim to target the detrimental accumulation of toxic by-products of the visual cycle in the RPE, appear as promising pharmaceutical agents to slow down the progression of atrophy.
Fenretinide (N-[4-hydroxyphenyl] retinamide), an oral compound, has been shown to lower the production of toxic fluorophores in the RPE in a dose-dependent manner in the albino ABCA4 -/- mice.15 This vitamin A derivate acts by competing with serum retinol for the binding sites of retinal-binding protein and promotes renal clearance of retinol. The bioavailability of retinol for the RPE and photoreceptors is consequently reduced and fewer toxic retinoid by-products such as A2-E may be generated. A Phase II, randomized, double-masked, placebo-controlled multicenter study that aims to include more than 200 GA patients has been already initiated in the United States in 2006 (Sirion Therapeutics). The therapeutic concept of Fenretinide is not only underscored by previous FAF findings. To reduce the observational period in a slowly progressive disease, to minimize the sample size and to better demonstrate possible treatment effects, the patient recruitment in this study involves the identification of high-risk features in this first large interventional trial in patients with geographic atrophy secondary to AMD.
Due to the increased sensitivity and improved signal-to-noise ratio, modern cSLO allows—in addition to the well-known fundus autofluorescence with blue excitation light as described above—for visualization of FAF phenomena by near-infrared light.13,28
Hereby, the so-called ICG-mode is used. Application in patients and case reports in animal models and donor eyes suggest that near-infrared FAF detects fluorophores at the level of the retinal pigment epithelium. Melanin has been postulated as the major candidate. However, no spectral analyses of lipofuscin for blue light FAF have been reported.
The recent introduction of combined simultaneous spectral-domain optical coherence tomography with cSLO imaging, in one instrument with real-time eye tracking that allows for accurate orientation of OCT-scans and therefore for three-dimensional mapping of pathological changes at specific anatomic sites, represents an important step forward to better investigate the origin of the FAF signal within the retina.5,6,8,29,30
Dr. Fleckenstein is a research and clinical fellow in the department of ophthalmology at the University of Bonn. Contact her at
Monika.Fleckenstein@ukb.uni-bonn.de. Dr. Holz is director of the department of ophthalmology at the university. Contact him at
Frank.Holz@ukb.uni-bonn.de. Dr. Schmitz-Valckenberg is a consultant at the department and executive of the GRADE Reading Center, Bonn. Contact him at
Steffen.Schmitz-Valckenberg@ukb.uni-bonn.de.
1. Bergmann M, Schutt F, Holz FG, Kopitz J. Inhibition of the ATP-driven proton pump in RPE lysosomes by the major lipofuscin fluorophore A2-E may contribute to the pathogenesis of age-related macular degeneration. Faseb J 2004;18:562-564.
2. Dandekar SS, Jenkins SA, Peto T, et al. Autofluorescence imaging of choroidal neovascularization due to age-related macular degeneration. Arch Ophthalmol 2005;123:1507-1513.
3. Deckert A, Schmitz-Valckenberg S, Jorzik J, et al. Automated analysis of digital fundus autofluorescence images of geographic atrophy in advanced age-related macular degeneration using confocal scanning laser ophthalmoscopy (cSLO). BMC Ophthalmol 2005;5:8.
4. Delori FC, Dorey CK, Staurenghi G, et al. In vivo fluorescence of the ocular fundus exhibits retinal pigment epithelium lipofuscin characteristics. Invest Ophthalmol Vis Sci 1995;36:718-729.
5. Drexler W, Morgner U, Ghanta RK, et al. Ultrahigh-resolution ophthalmic optical coherence tomography. Nat Med 2001;7:502-507.
6. Fleckenstein M, Charbel Issa P, Helb HM, et al. High-resolution spectral domain-OCT imaging in geographic atrophy associated with age-related macular degeneration. Invest Ophthalmol Vis Sci 2008;49:4137-4144.
7. Heimes B, Lommatzsch A, Zeimer M, et al. Foveal RPE autofluorescence as a prognostic factor for anti-VEGF therapy in exudative AMD. Graefe's Arch Clin Exp Ophthalmol 2008 Sep;246(9):1229-34. Epub 2008 May 29.
8. Helb HM, Charbel Issa, P, Fleckenstein M, et al. (2008) Clinical evaluation of simultaneous confocal scanning laser ophthalmoscopy imaging combined with high-resolution, spectral-domain optical coherence tomography. Ophthalmologica [accepted for publication 2008].
9. Holz FG, Schmitz-Valckenberg S, Spaide RF, Bird AC. Atlas of Fundus Autofluorescence Imaging. Berlin: Springer, 2007.
10. Holz FG, Bellman, C, Staudt, S, et al. Fundus autofluorescence and development of geographic atrophy in age-related macular degeneration. Invest Ophthalmol Vis Sci 2001;42:1051-1056
11. Holz FG, Bindewald-Wittich A, Fleckenstein M, et al. Progression of geographic atrophy and impact of fundus autofluorescence patterns in age-related macular degeneration. Am J Ophthalmol 2007;143:463-472
12. Jorzik JJ, Bindewald A, Dithmar S, Holz FG. Digital simultaneous fluorescein and indocyanine green angiography, autofluorescence, and red-free imaging with a solid-state laser-based confocal scanning laser ophthalmoscope. Retina 2005;25:405-416.
13. Keilhauer CN, Delori FC. Near-infrared autofluorescence imaging of the fundus: Visualization of ocular melanin. Invest Ophthalmol Vis Sci 2006;47:3556-3564.
14. Poloschek CM, Hansen LL, Bach M. (2007) Annular fundus autofluorescence abnormality in a case of macular dystrophy. Doc Ophthalmol 2008 Mar;116(2):91-5. Epub 2007 Nov 16.
15. Radu RA, Han Y, Bui TV, et al. Reductions in serum vitamin A arrest accumulation of toxic retinal fluorophores: A potential therapy for treatment of lipofuscin-based retinal diseases. Invest Ophthalmol Vis Sci 2005;46:4393-4401.
16. Robson AG, Saihan Z, Jenkins SA, et al. Functional characterisation and serial imaging of abnormal fundus autofluorescence in patients with retinitis pigmentosa and normal visual acuity. Br J Ophthalmol 2006;90:472-479.
17. Robson AG, Michaelides M, Saihan Z, et al. Functional characteristics of patients with retinal dystrophy that manifest abnormal parafoveal annuli of high density fundus autofluorescence; a review and update. Doc Ophthalmol 2008 Mar;116(2):79-89. Epub 2007 Nov 6.
18. Sawa M, Ober MD, Spaide RF. Autofluores-cence and retinal pigment epithelial atrophy after subretinal hemorrhage. Retina 2006;26:119-120.
19. Schmitz-Valckenberg S, Jorzik J, Unnebrink K, Holz FG. Analysis of digital scanning laser ophthalmoscopy fundus autofluorescence images of geographic atrophy in advanced age-related macular degeneration. Graefe's Arch Clin Exp Ophthalmol 2002;240:73-78.
20. Schmitz-Valckenberg S, Bultmann S, Dreyhaupt J, et al. Fundus autofluorescence and fundus perimetry in the junctional zone of geographic atrophy in patients with age-related macular degeneration. Invest Ophthalmol Vis Sci 2004;45:4470-4476.
21. Schmitz-Valckenberg S, Bindewald-Wittich A, Dolar-Szczasny J, et al. Correlation between the area of increased autofluorescence surrounding geographic atrophy and disease progression in patients with AMD. Invest Ophthalmol Vis Sci 2006;47:2648-2654.
22. Scholl HP, Bellmann C, Dandekar SS, et al. Photopic and scotopic fine matrix mapping of retinal areas of increased fundus autofluorescence in patients with age-related maculopathy. Invest Ophthalmol Vis Sci 2004;45:574-583
23. Spaide R. Autofluorescence from the outer retina and subretinal space: Hypothesis and review. Retina 2008;28:5-35.
24. Spaide, R F, Autofluorescence Imaging with the fundus camera. In: Holz FG, Schmitz-Valckenberg S, Spaide RF and Bird AC. Autofluorescence Imaging with the fundus camera. Springer: Berlin 2007:51.
25. Sparrow JR, Boulton M. RPE lipofuscin and its role in retinal pathobiology. Exp Eye Res 2005;80:595-606.
26. Vaclavik V, Vujosevic S, Dandekar SS, et al. Autofluorescence Imaging in Age-Related Macular Degeneration Complicated by Choroidal Neovascularization: A Prospective Study. Ophthal-mology. 2008 Feb;115(2):342-6. Epub 2007 Jun 28.
27. von Ruckmann A, Fitzke FW, Bird AC. In vivo fundus autofluorescence in macular dystrophies. Arch Ophthalmol 1997;115:609-615.
28. Weinberger AW, Lappas A, Kirschkamp T, et al. Fundus near infrared fluorescence correlates with fundus near infrared reflectance. Invest Ophthalmol Vis Sci 2006;47:3098-3108.
29. Wojtkowski M, Bajraszewski T, Gorczynska I, et al. Ophthalmic imaging by spectral optical coherence tomography. Am J Ophthalmol 2004;138:412-419.
30. Wolf-Schnurrbusch UE, Enzmann V, Brinkmann CK, Wolf, S. Morphologic changes in patients with geographic atrophy assessed with a novel spectral OCT-SLO combination. Invest Ophthalmol Vis Sci 2008;49:3095-3099.
31. Schmitz-Valckenberg S, Fleckenstein M, Scholl HP, Holz FG. Fundus autofluorescence and progression of age-related macular degeneration. Surv Ophthalmol 2009 Jan-Feb;54:96-117.