Imaging technology not only complements what we learn from visual fields, it may also allow us to diagnose glaucoma or follow progression when a visual field cannot. Optical coherence tomography, for example, not only can pick up very early damage, it also gives us a structural measure that we can follow over time, even into the late, advanced stages of glaucoma. Historically, when someone had a central island of vision, which we would try to follow with 10-2 visual fields, the optic nerve was so damaged that there wasn’t much helpful information to elicit. But even in that situation there are still ganglion cells remaining, and OCT lets us measure and monitor them over time. (The Heidelberg Retina Tomograph is another popular tool, featuring a very robust progression analysis program.)
However, in recent years, all of the tools we use to help us make treatment decisions—including the imaging devices—have become more complex. This has led to increasing opportunities for errors and over-sights. Here, I’d like to discuss some ways we can avoid diagnosis- and treatment-related problems that can occur as a result of the way these technologies analyze progression.
The Impact of Treatment
The reason for trying to determine whether our patients are stable or progressing—and if progressing, at what speed—is to enable us to predict the probable future of the patient’s vision. Our measurements, made via visual fields and imaging devices, allow us to make this assessment, and that knowledge then allows us to intercede, if necessary, to change the probable future for the better.
|
The first problem—our treatment affecting our measurements—usually relates to the change in intraocular pressure our treatments are designed to cause. For example, the HRT is quite sensitive to IOP changes. It is often used to measure the optic nerve in front of the lamina cribrosa, but if the pressure suddenly increases from 10 to 30 mmHg, in many patients the lamina will bow back and the nerve will sink in, altering the HRT scan significantly. Similarly, if a patient presents to you with a pressure of 30 mmHg, and you’ve scanned the back of her eye, as long as that nerve still has lots of fibers and vessels and the lamina is still moving and hasn’t been crushed, once you lower her pressure 20 or 25 percent that nerve will pop back up towards you. Again, this will significantly alter the HRT scan.
What this means is that you can’t really compare someone’s HRT scan at a pressure of 30 mmHg to the same eye scanned with a pressure of 20 mmHg. If 20 mmHg will be the patient’s new normal pressure, then you have to reset your baseline. (For this reason, it’s important to note in the record what the patient’s IOP was at the time the HRT scan was done.)
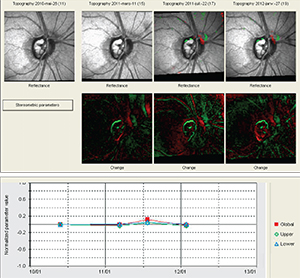
This concern also applies to OCT scans, although to a lesser extent. OCT technology scans a much thinner structure, which means there’s not as much tissue to compress or expand when the IOP increases or decreases. However, in our practice we have seen artifacts of this change on some event-based analyses using the OCT. For example, we had a patient who had uneventful Cirrus OCT scans for quite some time. Then he suddenly showed signs of progression on event-based analysis. Indeed, the scans now looked very different from the earlier scans. It turned out that when the first five scans were taken, the patient’s pressure was fluctuating between 4 and 6 mmHg. The patient didn’t have great visual acuity; he was complaining of symptoms related to hypotony. The later scans were taken after the patient was treated and had a revision of his glaucoma filtering procedure. This raised his pressure to between 10 and 12 mmHg; he was happier, and so were we. The OCT, however, said that he was getting worse.
This example shows that extreme variations in pressure, such as between hypotony and a more normal IOP, can affect measurements made using OCT.
|
Resetting the Baseline
The second often-overlooked aspect of these statistical analyses (trend- or event-based) is that you may need to change the exams you’re using as your baseline after significant changes have occurred inside the eye. This is especially important given that glaucoma is a chronic disease, with many tests done over many years. Physicians often fail to make this adjustment, with the result that the statistical analyses may continue to say that the patient is getting worse when the patient is actually stable, leading to inappropriate and unnecessary treatment. Or, the analyses may indicate that the patient is stable when he’s actually getting worse, leading to insufficient treatment.
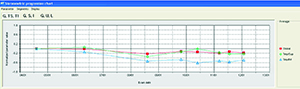
Trend-based analysis takes a measurement, such as the mean deviation of the visual field, and plots it over time to determine whether there is a significant slope. The slope is drawn starting at the first two baselines—as you have chosen them—and ending at the most recent points measured. The problem arises when a change in the patient’s status has occurred, and the new points on the graph are actually much closer to the recent measurements. The shallower slope between them indicates slower progression or even stabilization—but the instrument will still be drawing the line between your original baseline and the new points. The resulting slope might change somewhat, but the analysis will still report that the patient is worsening. In contrast, if you reset the system by creating a new baseline based on exams done after the patient’s status has changed, the analysis might no longer find any significant slope at all.
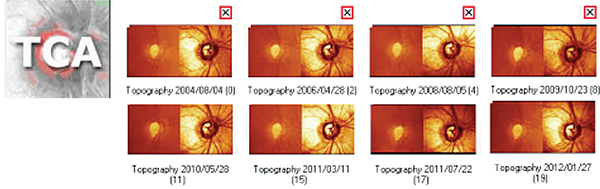
For example, suppose you met your patient in 2004 and put her on a prostaglandin analogue. Her resulting pressure was running in the high teens, and over the next two or three years both imaging and visual fields indicated progression. At this point you decide to increase her therapy, so you add a combination agent, or perhaps perform selective laser trabeculoplasty. Her pressure will be lowered even further, and you’ll continue to follow her with visual fields and imaging. However, if you perform a trend or event analysis, you’ll still be comparing to your initial baseline, which may continue to indicate that the patient is getting worse.
This can be particularly challenging with event-based analysis. After five exams, for example, the triangles indicating progression in Humphrey’s GPA analysis may be completely black, and the blackness won’t go away unless the patient has improvement in the visual field, which is an infrequent occurrence. Changing to a new baseline resets the measurement.
So, once the patient has progressed and you’ve altered her therapy, you have to establish a new baseline. Let’s say I added a combination agent in 2006. The first visit after putting her on the new medication would be my new baseline exam one; she would have to come back six months later for baseline exam two. After that, any analysis will show whether the patient is getting worse on the current therapy.
Failing to do this can also backfire by leading the clinician to believe the patient is not progressing when she actually is. I recently encountered a patient whose physician had been following her with a series of HRTs that didn’t seem to be changing much on event-based analysis. But this analysis was based on a much earlier baseline. When we reset the baseline to a more recent set of exams, the analysis showed that over the past four years the patient had been getting worse. Needless to say, failing to reset your baseline could have significant consequences for your patient. (Note: On rare occasions, a patient’s vision may actually improve after aggressive pressure-lowering; this might also call for a baseline reset.)
The need for a baseline reset can follow other kinds of changes as well. Certainly if your patient has a stroke that affects his visual field, that will affect all of your measurements. The same is true of a patient who has a retinal vein occlusion, or some other event or condition that affects the optic nerve or retinal nerve fiber layer. A patient who is diabetic may develop hemorrhages and macular edema, which may necessitate resetting the baseline, especially if the event leaves a scar. (Of course, some retinal pathologies can make the ganglion cells almost impossible to measure, regardless of other considerations.)
Maximizing Our Tools
|
• Do more testing at the outset. When you initially follow your glaucoma patients, test them more often so you can quickly determine which patients are progressing, and at what rate. If you only take one visual field a year, it could take three or four years for you to determine that a patient is losing 2 db per year. That patient is a rapid progressor, probably in need of more aggressive treatment. In contrast, if you do six or seven visual fields in the first two years, you’ll detect that rapid progression much more quickly.
In addition, for statistical purposes when doing event-based analysis, it’s important to have two baseline exams. That’s true whether you’re using HRT, OCT, GDx or visual fields. (Most of these instruments do both trend- and event-based analysis using their own software, such as the GPA analysis in the Humphrey visual field analyzer.) The instrument will average the two baseline exams and compare future exams to that average. For that reason, event-based analysis is impossible until you’ve performed at least three or four tests.
• Make sure you have good-quality exams. Both trend- and event-based analysis depend on good measurements. When doing visual fields, we want to make sure the results are reliable—that there are not too many false positives or false negatives. With the imaging instruments, the scan has to be well-centered; when using HRT it has to have a good standard deviation; and when using OCT each scan needs to have a good signal-to-noise ratio. Overall, you always want to get the best-quality image you can obtain from that patient. Furthermore, you want to make sure that the quality of the images is equally good over the series of exams, and make sure that the optic nerve looks similar from one exam to the next.
• Use both event and trend analysis. Trend-based analysis tracks a given measurement over a series of exams to determine the rate of change, enabling us to project the likely future status of that measurement (if the eye were left in its current condition). In contrast, event-based analysis looks at a specific area of interest and compares it to a baseline measurement to see whether or not a given change has occurred. Both types of measurement can be done with visual fields and imaging, and both give us useful information. In addition, they can act as a reality check on one another.
Ideally, we want to see agreement between the two types of measurement. If both event and trend analysis indicate that a patient is getting worse, we can feel more confident in our treatment choices. It’s even better if the event and trend-based analyses agree on both imaging and visual fields; that’s the equivalent of a home run. But when only one of them says there’s a problem, and nothing else seems to be changing, we have to wonder: Is that measurement accurate? Did something happen to the reliability of the visual fields? Did something affect the quality of the acquired images? A disagreement can thus alert us to a potential problem with our measurements, and spare the patient a treatment decision based on faulty information.
Staying on Track
| Undoubtedly, the worst outcome of overlooking these issues would be to miss progression. |
To avoid an undesirable patient outcome, make sure to check the quality of your imaging and visual fields; do both event- and trend-based analyses; make sure you do enough tests, especially when first working with a patient; and be sure to reset what you consider to be the baseline when the patient’s clinical status, therapy status or IOP have undergone a significant change. REVIEW
Dr. Harasymowycz is chief of glaucoma at the University of Montreal and director of the Montreal Glaucoma Institute. He has no financial ties to any product mentioned.