|

FAF is based on the excitation of inherent fluorophores within lipofuscin (e.g., A2E) by light of a certain wavelength (typically 488 to 595 nm) and recording the light emitted (~540 to >700 nm) to create a brightness map. Lipofuscin accumulation is believed to be a sign of metabolic stress of RPE cells, which may inhibit lysosomal protein degradation, activate reactive oxygen species and contribute to RPE apoptosis.3 FAF correlates with accumulation of these fluorophores in the RPE and outer retina and can indirectly provide an assessment of the integrity of the outer retina/RPE,2,3 indicative of retinal atrophy, RPE injury and photoreceptor loss (loss of photoreceptors causes loss of by-products). These changes may not otherwise be detectable with optical coherence tomography, fundus photography or fluorescein angiography. Such changes may occur in the setting of AMD, central serous retinopathy, ocular tumors, infectious and inflammatory conditions, as well as retinal degenerations.
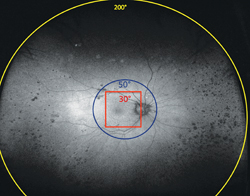
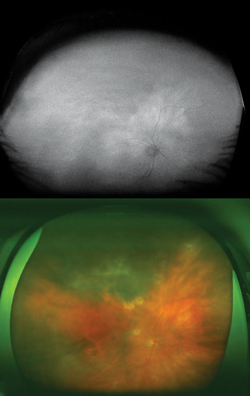
Traditional FAF utilizing conventional scanning laser ophthalmoscopes allows visualization of only the central 30 to 50 degrees of the fundus, primarily illustrating posterior pole pathology. Simultaneous imaging of the central and peripheral retina in the form of a topographical RPE map will significantly aid in the diagnosis and management of diseases with any extramacular manifestation (See Figure 1).
Widefield autofluorescence (WFAF) (Optomap P200Tx) utilizes a multi-wavelength scanning laser ophthalmoscope with red (633 nm), green (532 nm) and blue (488 nm) scanning lasers simultaneously scanning individual retinal layers within the yellow-orange-red wavelengths.
The green wavelength is used for excitation, and the emission is detected in the red end of the spectrum. Virtual point SLO technology allows images to be captured from a “virtual” focal point posterior to the patient’s iris and scans up to 200 degrees of the retina (~82 percent) with an image capture time of 0.25 seconds/scan and 3900 x 3072 pixel optical resolution even in non-mydriatic pupils.
|

In a retrospective analysis at a tertiary referral center, abnormal autofluorescence patterns were identified outside the central 30 degrees in nearly 70 percent of patients with AMD, CSR, ocular tumors, inflammatory/infectious disease, retinal dystrophies, diabetic retinopathy, retinal vascular occlusive disease and albinism.4 Several of these are highlighted below.
AMD
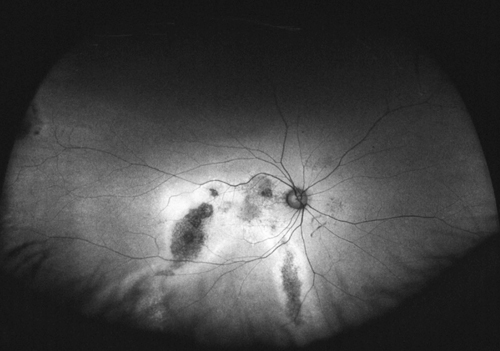
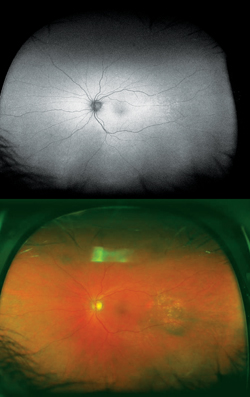
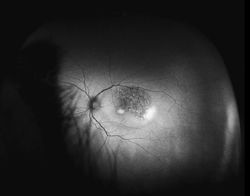
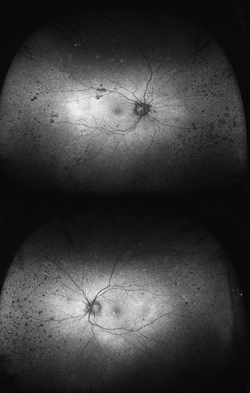
Although not completely understood, the interplay between the RPE, neurosensory retina and Bruch’s membrane in AMD is integral to the development of severe visual loss. This may manifest as pigment epithelial detachment, choroidal neovascularization with subsequent subretinal fluid accumulation or hemorrhage, or as atrophy. In patients with geographic atrophy, certain AF phenotypes, specifically involving the junctional zone of geographic atrophy, confer prognostic risk of progression, and AF abnormalities may herald the development of new areas of atrophy.5 WFAF may be helpful in tracking these areas over time and identifying peripheral derangements of RPE, which may have prognostic implications not yet understood (See Figures 2 & 3). This is being further studied by the Age Related Eye Disease Study II.
| ||||||||
Central Serous Retinopathy
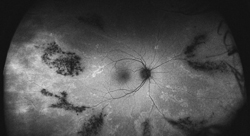
Typically, FAF is increased in active stages due to increased metabolic activity within the RPE and decreased in chronic states secondary to photoreceptor loss and reduced RPE metabolism.7 More widespread RPE disturbance seen in chronic/decompensated RPE is well illustrated by WFAF, and this finding may be helpful in identifying other areas of RPE derangement not currently active as well as in monitoring disease progression or the development of recurrence. In particular the fluid tracks (“gutters”), manifest as large vertically oriented bands of increased FAF seen on widefield imaging, may be particularly helpful in confirming the diagnosis (See Figure 4).
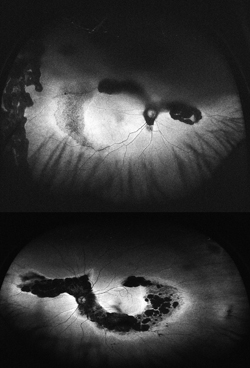
Ocular Tumors
Choridal nevi, melanomas and hemangiomas sometimes present a diagnostic and management challenge. Currently managed through a combination of ultrasound, OCT, fundus photography and fluorescein angiography, WFAF represents a potential additional modality to monitor these lesions. Choroidal nevi typically show little intrinsic AF but demonstrate extrinsic hypoautofluorescence due to RPE atrophy or hyperautofluorescence of orange pigment8 (See Figure 5). Choroidal melanomas also show little intrinsic autofluorescence except in the cases of pigmented tumors, larger tumors and those with RPE disruption, overlying orange pigment or subretinal fluid, which are typically hyperautofluorescent9 (See Figure 6). Choroidal hemangiomas also show little intrinsic autofluorescence but demonstrate hyperautofluorescence extrinsically secondary to associated overlying orange pigment and subretinal fluid. Associated RPE hyperplasia and atrophy show hypo-autofluorescence10 (See Figure 7). Interestingly, autofluorescence has also been shown to change following treatment. Specifically, choroidal melanomas show increased extrinsic autofluorescence following treatment due to increased lipofuscin and pigment accumulation.6 WFAF may be helpful in delineating small peripheral melanocytic tumors as well as demonstrating the entirety of tumors in a single photograph. Clinically, this can make following tumor growth (horizontal/vertical dimensions) and response to treatment simpler.
|
In uveitic conditions, peripheral findings are often just as diagnostically and therapeutically important as posterior pole changes. In conditions such as birdshot chorioretinopathy (BSCR) (as well as other white dot syndromes) and Vogt-Koyanagi-Harada disease (VKH), peripheral lesions at the level of the RPE and choroid are an important part of disease presentation, for which WFAF can be a potentially useful addition to the uveitis practitioner’s armamentarium. In general, areas of hyperautofluorescence correspond to hyperplastic RPE and areas of hypoautofluorescence correlate with areas of atrophy or scarring from previous inflammation. These areas of hypoautofluorescence may also correspond to irreversibly damaged areas of RPE.11
In BSCR and VKH, WFAF findings have also been found to correlate with visual field defects as areas of reduced FAF correspond to areas of significant choroidal damage.11 WFAF has a significant advantage over visual field assessment in that it is not technician- or patient-dependent and can objectively be monitored over time (See Figure 8).
In one cohort of patients, it was found that FAF may be helpful in longitudinally following patients with BSCR, serpiginous choroidopathy, multifocal choroiditis, and acute zonal occult outer retinopathy. WFAF may also help distinguish serpiginous choroidopathy from tuberculous-associated serpiginous-like choroidopathy. Furthermore, the study showed that foveal hypoautofluorescence may correlate with decreased visual acuity in white dot syndromes.12 In patients with VKH disease, three peripheral FAF abnormalities were identified using WFAF: multifocal hypoautofluorescent dots; hyperautofluorescent spots; and a lattice-like pattern.13 The use of WFAF in these cases has the potential for significant clinical utility in the monitoring and management of these patients longitudinally and may help predict early disease recurrence, as well as visual field constriction.
Retinal Dystrophies
Hereditary retinal dystrophies are generally associated with increased FAF and this imaging tool has been helpful in patients with central areolar choroidal dystrophy (CACD); pattern dystrophy; Stargardt’s disease; Best’s vitelliform macular dystrophy; cone-rod dystrophy; retinitis pigmentosa; peripherin/RDS mutation-associated retinopathies; and pigmented paravenous retinochoroidal atrophy. In most retinal dystrophies, there is significant phenotypic variation and FAF variability. In Stargardt’s, however, a non-random radial expansion of hyperautofluoresent lesions from the fovea with a following trail of diminishing autofluorescence has been identified, and both foveal and peripheral findings are important in delineating this pattern.14 A speckled pattern distinct from that observed in non-neovascular AMD has been described in CACD, and this finding may help identify those individuals with mutations in the rds/peripherin gene.15 In Best’s disease, initial stages have been associated with localized areas of intense hypoautofluorescence centrally which are replaced by central hypofluoresence secondary to atrophy, with surrounding hyperautofluorescent rings, and these may correlate with visual function.16 WFAF maybe a useful modality for following patients with these dystrophies, although fundus angiography and molecular genetic analysis remain the gold standard for diagnosis.17
WFAF provides a non-invasive assessment of the health of the RPE throughout the retina. Areas of abnormal AF are commonly outside the posterior pole and this information may be helpful in a variety of retinal conditions, specifically in inflammatory disorders, retinal dystrophies and CSR. WFAF may also be helpful in determining prognosis in patients with AMD, although this needs confirmation in larger trials (i.e., AREDS2). As WFAF is used in more retinal diseases and studied in conjunction with spectral-domain OCT, fluorescein angiography and indocyanine green angiography, it may provide new insights into disease pathogenesis and prognosis. REVIEW
Dr. Raiji is a medical retina fellow and Dr. Sadda is an associate professor of ophthalmology, the director of the Medical Retina Unit, the Ophthalmic Imaging Unit and the Doheny Image Reading Center. Contact him at Doheny Eye Institute, Keck School of Medicine, University of Southern California, 1450 San Pablo S. DEI 3615, Los Angeles, CA 90033. Phone: (323) 442 6503; fax: (323) 442 6460; e-mail:
ssadda@doheny.org.
1. Delori FC, Dorey CK, Staurenghi G, et al. In vivo fluorescence of the ocular fundus exhibits retinal pigment epithelium lipofuscin characteristics. Invest Ophthalmol Vis Sci 1995;36:718-729
2. Schmitz-Valckenberg S, Holz FG, Bird AC, Spaide RF. Fundus Autofluorescence Imaging Review and Perspectives. Semin Ophthalmol 2010 Sep-Nov; 25 (5-6): 206-13.
3. Spaide RF. Fundus Autofluorescence and Age-related Macular Degeneration. Ophthalmology 2003;110:392–399.
4. Sadda SR, Tan C, Heussen F. Widefield Autofluorescence: A new tool to study macular and retinal disease. AAO Retina Subspecialty Day 10/22/11, Orlando, FL.
5. Holz FG, Bindewald-Wittich A, Fleckenstein M, Dreyhaupt J, et al. Progression of Geographic Atrophy and Impact of Fundus Autofluorescence Patterns in Age-related Macular Degeneration. Am J Ophthalmol 2007;143:463-472.
6. Roisman L, Lavinsky D, Megalhaees F, Bom Aggio F, et al. Fundus Autofluorescence and Spectral Domain OCT in Central Serous Chorioretinopathy. J Ophthalmol 2011;2011:706849. Epub 2011 Aug 8.
7. Gündüz K, Pulido JS, Bakri SJ, Amselem L, et al. Fundus autofluorescence of choroidal melanocytic lesions and the effect of treatment. Trans Am Ophthalmol Soc 2007;105:172-8; discussion 178-9.
8. Shields CL, Pirondini C, Bianciotto C, Materin MA, et al. Autofluorescence of choroidal nevus in 64 cases. Retina 2008 Oct;28(8):1035-43.
9. Shields CL, Bianciotto C, Pirondini C, Matern MA, et al. Autofluorescence of choroidal melanoma in 51 cases. Br J Ophthalmol 2008 May;92(5):617-22.
10. Ramasubramanian A, Shields CL, Harmon SA, Shields JA. Autofluorescence of Choroidal Hemangioma in 34 Consecutive Eyes. Retina 2010; 30(1):16-22.
11. Seidensticker F, Neubauer AS, Wasfy T, Stumpf C, et al. Wide-field fundus autofluorescence corresponds to visual fields in choroioretinitis patients. Clin Ophthalmol 2011;5:1667-1671.
12. Yeh S, Forooghian F, Wong WT, Faia LJ, et al. Fundus Autofluorescence Imaging of the White Dot Syndromes. Arch Ophthalmol 2010;128: 46-56.
13. Heussen FM, Vasconcelos-Santos DV, Pappuru RR, Walsh AC, et al. Ultra-Wide-Field Green-Light (532-nm) Autofluorescence Imaging in Chronic Vogt-Koyanagi-Harada Disease. Ophthalmic Surg Lasers Imaging 2011;42:272-277.
14. Cuckras CA, Wong WT, Carsuso R, Cunningham D, et al. Centrifugal Expansion of Fundus Autofluorescence. Patterns in Stargardt Disease Over Time. Arch Ophthalmol 2012;130:171-9. Epub 2011 Oct 10.
15. Smailhodzic D, Fleckenstein M, Theelen T, Boon CJF, et al. Central Areolar Choroidal Dystrophy (CACD) and Age-Related Macular Degeneration (AMD): Differentiating Characteristics in Multimodal Imaging. Invest Ophthalmol Vis Sci 2011 Nov 21;52(12):8908-18.
16. Jarc-Vidmar M, Kraut A, Hawlina M. Fundus autofluorescence imaging in Best’s vitelliform dystrophy. Klin Monbl Augenheilkd 2003;220:861-7.
17. Boon CJF, Klevering J, Keunen JEE, Hoyng CB, Theelen T. Fundus autofluorescence imaging of retinal dystrophies. Vision Research 48 (2008) 2569-2577.