In an ideal world, we might be able to constantly monitor all of our patients and respond to changes in their condition the moment the changes appear, but this is not an ideal world. Furthermore, our constraints are likely to increase because we’re going to have even more limited resources for medical care in the future; fewer doctors will be treating a growing number of patients, while dealing with decreasing health-care funding. To make the best of this situation we’re going to have to focus on treating those patients who are at the greatest risk of losing vision.
To do that, we need to be able to identify those patients who are progressing quickly. The reality is that not everybody with glaucoma is going to go blind. Depending on their age and other factors, many patients who have a slow rate of progression may do well without any treatment at all. If a 70-year-old patient has a very slow rate of progression, he’s not going to go blind within the next 30 years. You can leave him alone, saving him the cost and morbidity of treatment. On the other hand, a young patient who is getting worse fast is likely to lose his vision if left untreated. That’s not only a bad situation for the individual, but comes with a great cost to our society (as numerous studies have shown). These patients need more aggressive treatment.
The point is that we need to get the right level of treatment to the right patients at the right time. Without having reasonably accurate estimates of progression rates, we really don’t know which patients need intensive treatment and which don’t.
Separating Fast and Slow
|
|
Perhaps most important, the portion of the visual field that’s damaged is likely to get worse much faster than other parts of the field that have been relatively spared by the disease. In fact, the latter areas may not change at all; that’s just the nature of the pathophysiology of glaucoma. So, if you want to know whether a patient is progressing rapidly or slowly, it makes sense to focus on the parts of the visual field that are damaged, rather than on the field as a whole.
With that in mind, we recently developed a software system that can analyze a sequence of visual fields, identify locations that are progressing at faster rates than the remainder of the field, and then predict future deterioration of the field based on this information. In essence, the system mimics what an experienced glaucoma specialist would do, but because it’s digital, it can do it far more accurately. One of the fundamental problems of visual fields is that they’re highly variable, so it’s often difficult for a human brain to pick out the signal from the noise. But software is able to do it very quickly and reproducibly.
Using the Data
The reason that it’s helpful to pay less attention to the parts of the visual field that are progressing slowly (if at all) is that much of the slower degradation in the visual field is the result of aging or cataract formation rather than glaucoma. Our system keeps that from confounding the issue by removing that gradual shift from consideration.
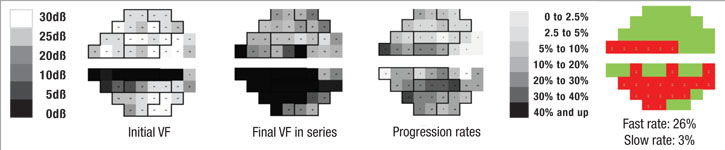
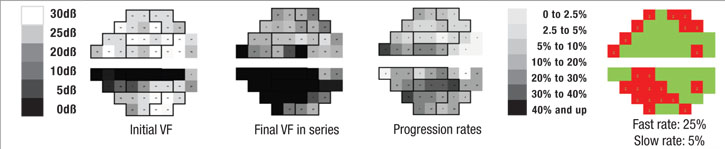
First, the software divides the field into areas that are getting worse relatively quickly and those that are getting worse relatively slowly, based on the preceding series of visual fields, using point-wise exponential regression (PER) analysis of threshold sensitivities. The rate of change seen in the slower areas may, to a small extent, represent glaucomatous dam-age, but for the most part it can be explained by the other causes. That means the deterioration seen in those areas is probably happening across the entire visual field, so the software subtracts that amount of deterioration from the entire field, leaving a net rate of progression that can be attributed solely to the disease. In fact, in most eyes the magnitude of the slow component compared to the fast component is actually pretty small, so when you subtract it out, it doesn’t make a very big difference. In some eyes, if the patient isn’t too old or has already had cataract surgery, the rate of change in the slow areas approaches zero.
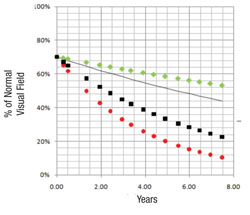
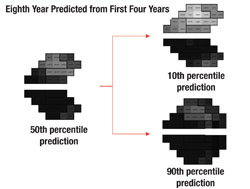
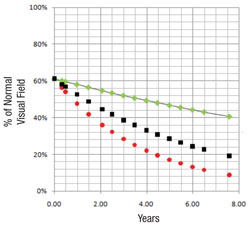
Next, the software uses this data to make predictions for what the visual field will likely look like in, say, five years if nothing changes (i.e., no change in treatment is undertaken). In other words, it projects into the future assuming that the future rate will be similar to the past rate. With statistical analysis, it produces a worst-case scenario, a best-case scenario and a most-likely scenario.
|
|
Validating the System
We’ve conducted two studies to validate this system as a means to separate the fast progressors from the slow progressors. The initial study involved fairly advanced patients with a lot of visual field damage from glaucoma1; it was based primarily on data collected during the Advanced Glaucoma Intervention Study. We included individuals with six or more years of follow-up and at least 12 visual field exams (389 eyes of 309 patients). Forecasts made by the system correlated well with the actual measured outcomes (p<0.001).
Two independent cohorts were also used to determine the software’s ability to differentiate areas of glaucomatous damage from reduced vision caused by cataract; the difference in rate of decay between faster and slower segments of the visual field were significantly greater among the glaucoma patients than among the cataract patients (19 ±10 percent vs. 5 ±5 percent, (p<0.001).
After we completed that study, our next concern was whether the system would work as well in patients with less damage. Some of the more globally based visual field progression analyzers have low sensitivity when testing patients with early damage, and produce highly variable results when used with patients who have advanced damage. So we wanted to be sure that our system would work well across the full range of visual field sensitivity.
The second group of patients we tested, 409 eyes of 279 open-angle glaucoma patients from the database at the University of California, Los Angeles, had much less glaucoma damage.2 Their data were also combined with the data from the first study to see how well the system worked over a broad range of damage levels. For comparison, predictive forecasts were calculated using both the mean deviation and visual field index forecasting systems; comparison of the prediction errors of the three approaches favored our system’s forecasts (p<0.001). Overall, the new system was successful at identifying high-risk rapid progressors across a broad range of disease severity.
We have another study, currently in press, in which we looked at 83 patients who underwent glaucoma surgery to see what effect the sur-gery had on their progression rates. In brief, the data showed that the surgery produced a significant reduction in the rate of progression in the fast-progressing parts of the visual field, but essentially no change in the rate of the slower-changing parts of the field. This suggests that the slower change is likely not a result of glaucomatous damage. (In fact, some eyes showed a slightly increased rate of progression in the slower areas after trabeculectomy; that makes sense, since trabeculectomy is known to accelerate the formation of cataract in some eyes.)
It’s worth noting some limitations to what these studies show. We required a minimum of five test locations in a visual field in each rate component in order to avoid mistaken identification of deterioration when none was present. How well the system would work with fewer deteriorating locations in a visual field cannot be determined from these trials. Also, it’s possible that a small subgroup of patients might have slow, diffuse glaucomatous damage, which may be reflected in the “slow” component.
|
What’s Next?
Once our system is thoroughly tested, its use should help clinicians distinguish between fast and slow progressors, directing more aggressive treatment to those patients who need it and helping to prevent unneeded treatment side effects and problems in patients who don’t. The software is not part of any commercial product at present (which may be partly be-cause it can be seen as a competing approach to existing analysis tools). However, there’s nothing secret about it and we don’t have any proprietary interest in it. We’ve already published the technique, so anybody can create similar software; there’s enough detail in the published articles to tell you exactly how to do it. Furthermore, anyone who has the skills and interest can tweak what we’ve developed.
At this point we’re still working on a Web-based version of the concept, and we expect to be ready to share it pretty soon. Once we feel that it’s perfected, anyone is welcome to use it. In the meantime, as the system proves its value, we expect that manufacturers will eventually choose to incorporate it into their products.
For now, I think it’s important to note that not only do our studies support the validity of the software program, they support the concept that accurate prediction of future progression depends largely on paying attention to the damaged areas of the visual field, not just global analyses. So until software for this purpose is available, I encourage clinicians to remember to focus on those areas when trying to decide which patients need intensive treatment. REVIEW
Dr. Caprioli is the David May II Professor of Ophthalmology, chief of the glaucoma division and director of the Glaucoma Basic Science and Clinical Laboratories at the Jules Stein Eye Institute in Los Angeles.
1. Caprioli J, Mock D, Bitrian E, et al. A method to measure and predict rates of regional visual field decay in glaucoma. Invest Ophthalmol Vis Sci 2001;52;7;4765-73.
2. Azarbod P, Mock D, Bitrian E, et al. Validation of point-wise exponential regression to measure the decay rates of glaucomatous visual fields. Invest Ophthalmol Vis Sci 2012;53:
5403-5409.