 |
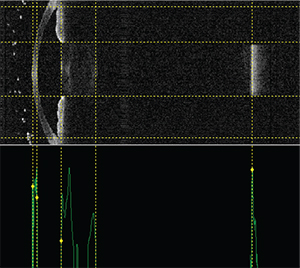
| New devices, such as the swept-source OCT Argos by Movu, may be able to help surgeons predict IOL powers better. From left to right, the vertical dotted lines indicate the anterior and posterior corneal surfaces, the anterior and posterior lens surfaces and the retinal surface. (Image courtesy H. John Shammas, MD.) |
The Generation Gap
Some surgeons think their colleagues should begin to break away from using third-generation IOL formulas and move toward fourth- and fifth-generation ones. They argue that the newer formulas use more variables, or key variables that purport to get the elusive effective lens position, which impacts the final refraction so heavily. Here’s a look at what some of these formulas might bring to the table.
• More measurements to use for calculation. The popular third-generation formulas, the Hoffer Q, Holladay I and the SRK/T use two input variables, keratometry and axial length, to try to predict effective lens position and, ultimately, the IOL power that should be used. The fourth- and fifth-generation formulas (the Holladay II, the Olsen formula and the Barrett Universal II formula) can use as many as seven variables (keratometry, axial length, anterior chamber depth, lens thickness, horizontal white-to-white measurement, age and preop refraction in the case of the Holladay II, for example). Some surgeons think more variables on the front end will mean fewer errors on the back end. “The older formulas were based on normal eyes,” explains Rockville Centre, N.Y., surgeon Eric Donnenfeld. “They looked at eyes without evaluating the effective lens position, the anterior chamber depth and the white-to-white measurement, for instance. When a patient’s eye was very short or very long, then, they got somewhat imprecise.”
H. John Shammas, MD, clinical professor of ophthalmology at the University of Southern California Medical School, says that this is true, but surgeons got used to working with the third-generation formulas’ idiosyncrasies and got good results. “For the past few years, the best formulas available have been the third-generation formulas,” he says. “Multiple articles have shown that, while the Holladay I works best for the average eye, the SRK/T works best for long eyes and the Hoffer Q works best for short eyes. After these three came out, Wolfgang Haigis, PhD, introduced the Haigis formula, which depends on axial length and the anterior chamber depth to determine where the implant sits. The Haigis is as good as the others in different categories of eyes, such as short, medium and long.” Specifically, surgeons now know that the Holladay I trends toward better outcomes in eyes between 22 and 26 mm long, the SRK/T toward better results in eyes over 26 mm, and the Hoffer Q in eyes shorter than 22 mm.1
Even though the newer formulas use more variables, that doesn’t necessarily mean they’ll be clearly superior in all cases to the older ones, however. In a study of eyes longer than 26 mm in which the IOL was at least -6 D, the SRK/T, Hoffer Q, Haigis, Barrett Universal II, Holladay II and Olsen formulas all met the benchmark of at least 71 percent of eyes within ±0.5 D of the predicted refraction and 93 percent within ±1 D. In long eyes with an error of less than 6 D of myopia, the Barrett Universal II, Holladay I and Haigis formulas using an anterior-length adjustment met those criteria.2 Also, in a small, retrospective study of eyes with small axial lengths, the researchers say none of the latest-generation formulas significantly outperformed the older ones.3
• More accurate ocular measurements. To get the most from many of the latest-generation formulas, you also need to have an optical biometer such as the IOLMaster 700 or the Lenstar. This is because two of the newer formulas, the Holladay II and the Olsen, require a measurement of the lens thickness that these types of cutting-edge machines can provide. Though this is a significant expense for the surgeon who is content using a combination of immersion ultrasound and keratometry, proponents of the new formulas point out that using optical biometry will bring better outcomes in the long run. “Since around the year 2000, optical biometry has been the standard of measurement for the eye,” says Dr. Shammas. “So, if any surgeon is still using ultrasound to measure the eye, upgrading to optical biometry would improve his results tremendously. Optical biometry’s accuracy is within 0.01 mm, while with immersion it’s 0.1 mm, so it’s 10 times more accurate.”
• A better predictor of ELP? This possible benefit is still undefined because the jury is still out on whether formulas that require the measurement of lens thickness—primarily the latest Olsen formula and the Holladay II—are truly better at predicting where the IOL will finally sit in the eye (the knowledge of which allows you to choose the right power for it). Proponents say the measurement does make a difference, however.
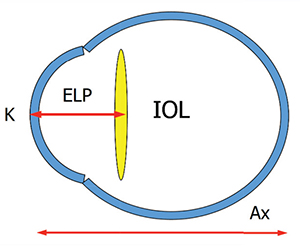 |
| Surgeons are trying to improve on the so-called thin-lens method of IOL calculation, which uses the K reading and axial length to try to predict the effective lens position. (Image courtesy Thomas Olsen, MD.) |
“In cataract surgery, you take out the crystalline lens and replace it with an artificial one,” Dr. Olsen continues. “The artificial one will be in a certain location in the empty capsular bag. The C constant, then, is actually a fraction of the lens thickness by which the center of the IOL will locate itself postop. For instance, say the C constant is 0.5. In that case, the IOL will locate itself exactly in the center of the crystalline lens—or actually the middle of the empty capsular bag. So, if I take a measurement of the lens thickness and I have the anterior chamber depth, I can add half the lens thickness to the anterior chamber depth and that will tell me where the center of the IOL should be after cataract surgery.” It might seem counter to the spirit of the new generation of formulas that the new Olsen formula only uses a couple of variables—mainly anterior chamber depth and lens thickness—rather than seven, but Dr. Olsen argues it’s not so much the number of your variables as having the right ones. “There have been a lot of multiple-variable formulas, and I have used them myself,” he says. “I once thought, ‘If I just put another variable in this formula, then I might get a better result. But it turned out to not be the case. Using the C constant gets down to the basics. The target of our surgery is the crystalline lens, and if we get the measurements right, we get the predictions right.” In terms of results, Dr. Olsen says in his practice the formula is enabling him to get his mean absolute error of his lens predictions to an average of 0.3 ±0.4 D.
Use What You Have
For surgeons who aren’t convinced they need to jump into the latest IOL formulas, and possibly have to make a new capital expenditure in the process, some experts say that, by optimizing the constants they use in their third-generation formulas, ophthalmologists can still get very good results.
• The Aristodemou method. Limassol, Cyprus, cataract and retinal surgeon Petros Aristodemou has published a method for optimizing third-generation formulas’ constants.1,4
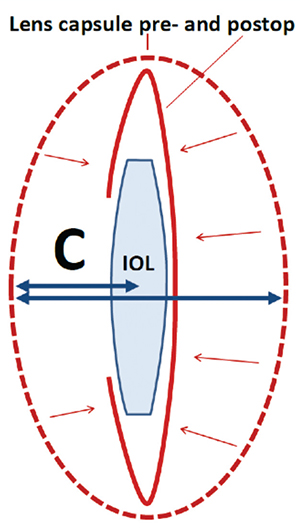 |
| The Olsen formula uses ray tracing to get the preop lens thickness and anterior chamber depth to derive C, which can be thought of as a fraction of the preoperative lens thickness. This C constant is then used to determine where the IOL will come to rest in the eye. (Image courtesy Thomas Olsen, MD.) |
• The grid method. Champaign, Ill., ophthalmologist Samir Sayegh says this method can be helpful if you’ve got enough surgical volume. “Create a 3 x 3 grid with axial length on one axis—with ‘short, medium and long’ as each column’s label—and K reading on the other axis, with the labels ‘flat, medium and steep,’ ” he explains. “This creates nine categories of eyes, one in each box of the grid. You can then optimize your constant ‘locally’ in each box. One problem, however, is that your number of cases is going to be divided by 9, and that’s assuming an even distribution over the grid, which is not likely. Instead, you’ll probably wind up having many eyes in the middle squares. However, at this point in their surgical careers, I believe many surgeons will have been using consistent techniques with their third-generation formulas and IOLs for a decade, so it’s likely that they will have a sufficient number of patients for the extremes of the grid to do a local optimization in those boxes. This method is preferable to taking someone else’s constant that was derived in another practice, using different devices from yours, with different methods of measuring values such as the K reading.”
Tips for Special Cases
In addition to advice for normal cases, surgeons also have some insights on how to improve your IOL results with particular patient presentations.
• The post-refractive surgery patient. Li Wang, MD, PhD, associate professor of ophthalmology at the Baylor College of Medicine in Houston, has published on how to approach cataract patients who have had refractive surgery, and she helps update the American Society of Cataract and Refractive Surgery’s online post-refractive IOL Calculator. “For the preop measurements of corneal curvature in post-refractive surgery eyes, we recommend doing as many scans as possible in the office with all the devices you have,” she says. “Then, input the results into the ASCRS IOL Calculator. If you get different measurements, you can use the average. If there is an obvious outlier, ignore it.”
| Formulas on the Rise |
| In addition to the fourth- and fifth-generation formulas, there are other formulas emerging as well, which should be making their way into general use this year. • Hoffer H-5. Developed by Santa Monica surgeon Kenneth J. Hoffer, the H-5 uses gender and race to change the average mean values in the Holladay-II and Hoffer Q formulas. By using gender and race to alter the predicted IOL power, the formula may be more customizable for a particular patient. The H-5 is licensed to the IOLMaster 700. • Radial basis function formula. Mesa, Ariz., lens calculation expert Warren Hill, MD, developed this mathematical approach with the assistance of engineers. In discussing the formula, Dr. Hill has commented that going outside the world of ophthalmology let them approach intraocular lens power selection in a different way that didn’t rely on traditional vergence formulas or estimation of the effective lens position. The RBF method will be added to the Lenstar, and will also be available as a web-based calculator. More information about the formula can be found at rbfcalculator.com. (Both Dr. Hoffer’s and Dr. Hill’s formulas were highlighted in the February 2016 installment of Technology Update.) • The Ladas Super Formula. Designed by Silver Spring, Md., surgeon John Ladas and Los Angeles surgeon Uday Devgan, the Super Formula makes a 3-D computer model based on five popular IOL formulas: the Hoffer Q; Holladay I; Holladay I with Koch adjustment; Haigis and SRK/T. It then uses the model and the formulas to help pick the ideal lens.1 (For an in-depth look at the Super Formula, see Review’s January 2016 cover story.) — W.B. 1. Ladas JG, Siddiqui AA, Devgan U, Jun AS. A 3-D “super surface” combining modern intraocular lens formulas to generate a “super formula” and maximize accuracy. JAMA Ophthalmol 2015;133:12:1431-6. |
• Correcting for an error in the first eye. In some instances, your IOL calculation for a patient’s first eye may turn out to be incorrect. Surgeons say there’s an algorithm you can use to help get the second eye on-target.
Dr. Shammas says you can base your second-eye prediction on a fraction of the first eye’s error, an approach that has been published in the literature.6 “What we advise is to account for half the error that was produced in the first eye and correct for that in the second eye,” he says. “So, if the first eye was off by 1 D, you’d correct for an additional 0.5 D in the second eye. This approach showed the best statistical results in a study. This approach makes sense because the error that occurred could be a combination of things, such as the measurements, the way the surgery was performed or even the movement of the implant to its final position. It’s hard to tell exactly what causes an error. So, by accounting for half of it, it brings the error closer to zero.”
• Use a variable toricity ratio with toric lenses. Dr. Sayegh, who has developed an IOL calculator of his own, thinks surgeons should be aware that using a fixed toricity ratio when implanting a toric lens can result in errors. “A fixed-toricity ratio has a similar effect on toric lenses as assuming a fixed effective lens position does on spherical lens calculations,” he explains. “This has been described in the literature.7,8 The toricity ratio is a conversion ratio from the astigmatism of the IOL to the astigmatism that will be corrected at the corneal plane, and the fixed toricity ratio that’s used by Alcon’s toric lens calculator and many others is roughly 1.5. This works fine for normal eyes, but if an eye is long and has a steep cornea the conversion ratio should be almost 2. So, for example, say you want to correct 1 D of corneal astigmatism in a very long eye. If you assume a fixed toricity ratio and use the 1.5 value, you would choose a 1.5 D toric lens, which, in a normal eye, would yield 1 D of treatment at the cornea. However, since this is a long eye and the factor is actually 2, you’d get only 0.75 D of correction, so the patient would have 0.25 D of residual astigmatism just from this alone. If you use a variable toricity ratio, you can avoid these astigmatic errors.”
Data will continue to emerge on the new formulas, and the push-pull forces will continue to exert themselves on surgeons. In the meantime, surgeons will have to sift through the literature and their data to get the best results. “When you get good or bad results, it’s hard to know exactly why,” says Dr. Sayegh. “Was it because your K readings were off by 0.75, or were they perfect and it was your calculation that was off? It’s a complex issue.” REVIEW
Dr. Donnenfeld is a consultant to Zeiss and Dr. Olsen is a consultant to Haag-Streit. Dr. Shammas’s post-refractive IOL formulas are licensed to most biometry units. Drs. Sayegh and Wang have no financial interest in the products mentioned.
1. Aristodemou P, Knox Cartwright NE, et al. Improving refractive outcomes in cataract surgery: A global perspective. World J Ophthalmol 2014;4:4:140.
2. Abulafia A, Barrett GD, Rotenberg M, et al. IOL calculation for eyes with an axial length greater than 26.0 mm: Comparison of formulas and methods. J Cataract Refract Surg. 2015;41:3:548.
3. Carifi G, Aiello F, Zygoura V, et al. Accuracy of the refractive prediction determined by multiple currently available intraocular lens power calculation formulas in small eyes. Am J Ophthalmol 2015;159:3:577-83.
4. Aristodemou P, Knox Cartwright N, Sparrow J. Intraocular lens formula constant optimization and partial coherence interferometry biometry: Refractive outcomes in 8108 eyes after cataract surgery. J Cataract Refract Surg 2011;37:50–62.
5. Wang L, Tang M, Huang D, et al. Comparison of newer intraocular lens power calculation methods for eyes after corneal refractive surgery. Ophthalmology 2015;122:12:2443-9.
6. Jivrajka RV, Shammas MC, Shammas HJ. Improving the second-eye refractive error in patients undergoing bilateral sequential cataract surgery. Ophthalmology 2012;119:1097-1101.
7. Savini G, Hoffer K, Ducoli P. A new slant on toric intraocular lens power calculation. J Refract Surg 2013;29:5:348-54.
8. Goggin M, Moore S, Esterman A. Outcome of toric IOL implantation after adjusting for anterior chamber depth and IOL sphere equivalent power effects. Arch Ophthalmol 2011;129:8:998-1003.


