OCT in particular has been evolving rapidly; we have seen an improvement in resolution and speed, and there has been improvement in the algorithms that isolate the layers of the retina. We can now get reliable measurement of nerve fiber layer thickness, better topographic information about the optic nerve head and good information regarding macular damage. But despite the availability of this technology in most practices, clinicians are still frequently confused about how to incorporate the information provided by OCT into clinical practice. Part of the reason for this is that combining structural and functional information can be a challenge.
Different Strengths
Structural scans such as OCT and functional tests such as visual fields perform better and provide more useful information at different stages of the disease. At the same time, they are complimentary; in many respects each compensates for the weaknesses of the other technology.
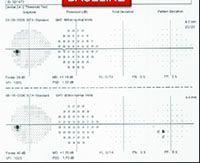
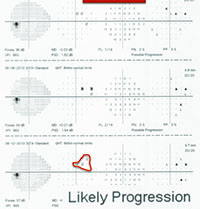
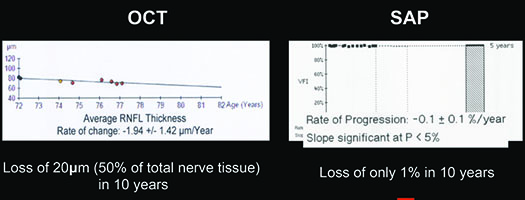
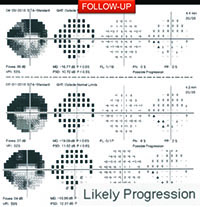
For example, visual fields usually perform poorly at detecting early damage in glaucoma. It is common to see patients develop substantial loss of nerve tissue while their visual fields remain within statistically normal limits. Because visual fields tend to underestimate the amount of neural damage in the early stages of the disease, they also tend to underestimate the rate of progression that may be occurring. (See example, p. 55.) That can give the misleading impression that your patient is progressing relatively slowly when he actually may be progressing quite rapidly.
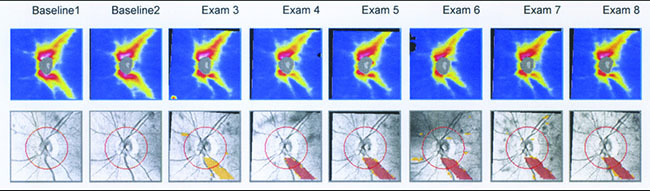
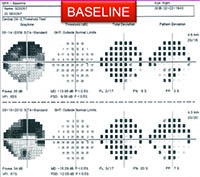
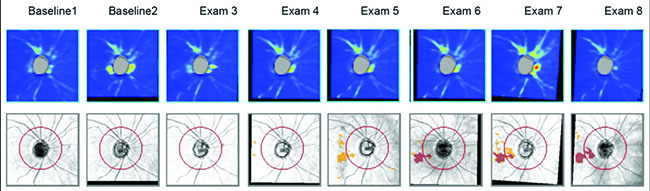
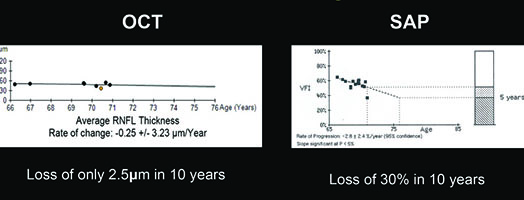
On the other hand, in early stages of the disease you can usually get a good assessment of structural damage using OCT. As a result, you can also measure early rates of change more accurately with OCT, alerting you to progression at a time when visual fields tend to show little damage. But like visual fields, OCT has its limitations; as the disease gets more advanced, OCT becomes ineffective. It has the problem of a floor effect; once glaucomatous damage reaches a certain point, OCT can’t detect any further damage or progression.1 (See example, p. 56.)
|
The result is that there’s sort of an inverse relationship between the efficacy of structure and function in detecting change, tied to disease severity. In early disease, visual fields usually tend to underestimate rate of progression, so you have to rely more on OCT. But later on, OCT starts to fail because of the floor effect so you need to rely more on visual fields. However, it is difficult to determine the exact point at which one test might perform better than the other for monitoring a specific patient. That’s why you really need to combine these two approaches—so you can evaluate progression and measure rates of change through all the stages of the disease. If you rely on the functional information provided by visual fields or OCT alone, you won’t detect every patient that is progressing.
At the practical level, this means changing your focus depending on the stage of each patient’s disease. In early disease, before the patient has a clearly established visual field loss, visual fields will frequently miss disease progression and underestimate the rate of neural loss. At that point in the disease you should rely more on a tool like the nerve fiber layer thickness assessment provided by OCT. Early in the disease, you should be acquiring these scans over time and looking for the rate of change. If that rate of change is fast, it could mean that your patient is at serious risk of future problems.
In fact, we have shown in a series of studies that these rates of change, measured with OCT, are indeed predictive of future visual field loss.2-4 We have also shown that they are predictive of functional impairment, as in patient-reported disability and difficulty doing everyday tasks.5 We demonstrated that if you have progression on these structural measures, that increases your chance of reporting a decrease in quality of life over time. In other words, what you’re measuring on OCT has clinical relevance, and it’s important for the patient.
|
However, when you get to moderate or more advanced stages of the disease, OCT will probably be performing poorly in terms of measuring rates of progression. So, once the patient has a visual field defect, you should pay close attention to rates of visual field loss. From that point forward, a visual field will probably provide you with more information than the OCT.
Simplifying the Combination
Unfortunately, combining structural and functional information can be easier said than done. Clinicians are often very confused about how to integrate information from a visual field and OCT scan—which will often disagree. Furthermore, even if a clinician understands that OCT is a better tool in early disease while visual fields are better in late disease, it may not be obvious how much the data from each test should be weighted at any given point in the disease.
Our group has been working on finding a simple way to combine these types of information for many years. We initially published some approaches that would allow the results of one test to influence the interpretation of the other. More recently we’ve been developing a single index that combines the two types of information, translating the results of both tests into a single common unit.6,7 This will provide clinicians with a much simpler way to use the information. We’ve published several studies validating our approach, and we hope that it will soon be incorporated into the software of commercially available instruments for widespread clinical use.
The Pros & Cons of Photos
With visual fields and OCT so popular today, stereo photographs have taken a back seat when it comes to glaucoma management. That’s partly because of their limitations: In particular, they’re relatively difficult to evaluate. You need skilled examiners to judge whether there is a change from one photograph to another, and even then there’s often poor agreement between examiners. Another limitation of photos is that they cannot provide you with a quantitative assessment of rates of change over time. As a result, many clinicians today don’t bother acquiring stereo photographs.
However, stereo photographs have some important advantages. For one thing, they’re not very susceptible to technology change. If you have a photo that was taken 20 years ago, you can get a new photograph and compare them. Photos provide you with a time-tested way of obtaining documentation of the optic nerve appearance. That’s not true with technology like OCT, which may change every few years, making it difficult or impossible to compare current scans with previous ones. Another advantage of stereo photographs is that there are things you can see on a photograph that are difficult to see on an OCT scan, such as optic disc hemorrhages.
For these reasons, I believe it’s still important to take stereo photographs. I take them in my clinical practice, although not as frequently as I get OCTs. That’s because a series of OCTs will allow you to estimate the rate of disease progression—something you can’t really do with photographs. So, there’s no need to take stereo photographs as often as you get OCTs. Nevertheless, I do think it’s worth getting them in all patients because of their other advantages.
Strategies for Success
At the present time, there are several things clinicians can do to help ensure they use the information from structure and function most effectively:
• If you have OCT, use it to assess progression. Although many clinicians are using OCT, some only use it for a cross-sectional assessment. The greatest benefit of this technology is to assess rates of structural damage over time, especially early in the disease, so you can estimate the risk that your patient is going to have trouble in the future. Most of the commercially available OCTs have algorithms that can estimate rates of disease progression.
• Don’t rely on a single-visit risk assessment. Current risk calculators for glaucoma are designed to estimate risk based on a single visit, but you can get a far more meaningful estimate by following patients over time. If you’re seeing deterioration on your structural measurements—whether it’s something like rim area or retinal nerve fiber layer thickness—that tells you what the trend is. (We have shown that the accuracy of your estimate of risk of progression improves as you incorporate longitudinal information over time.)2
• Be aware that structural and functional measurements may disagree. The fact that they disagree does not mean that one is right and the other one is wrong. In addition to their different limitations and capabilities, they use different measurement scales. For example, visual field data are obtained and reported in logarithmic scale; OCT data are calculated in linear scale. This is a source of disagreement, which can also come from the fact that OCT and visual fields may have different variability throughout the stages of disease. All of this means that they will often disagree—maybe even in the majority of cases. That doesn’t mean that one test is right and the other is wrong.
• Rate of progression is key. One thing many clinicians are still not doing is paying attention to the rate of disease progression. It’s not enough to know that progression has occurred; you need to know how fast the deterioration is occurring so you can decide how aggressively you need to treat and how frequently you need to monitor the patient. A patient may be progressing at a slow rate that will not cause her any problems over her expected lifetime; or she could be progressing rapidly, making it very likely that she’ll end up disabled during her lifetime.
• Keep the strong points of each technology in mind. Remember to rely more heavily on information such as change picked up by OCT, as long as a patient has not yet shown a defect on visual field tests. Once defects begin to show up on the visual fields, both structural and functional information become valuable. As the disease becomes more advanced, OCT won’t be able to measure any further change, so visual fields will become your best monitoring tool.
• Consider other risk factors. Most clinicians do this in a subjective and not very precise way; if the patient has high pressure and you see a suspicious change in the visual field, that change acquires more importance. If everything looks very well-controlled and you see a suspicious change you’re not sure about, you know it’s less likely that it represents real progression. Of course, it would be helpful to have some clinically proven algorithms to help us make these kinds of decisions more objectively. We published data a few years ago demonstrating that it’s possible to create such algorithms,8 but we haven’t yet translated that into a tool clinicians can use in everyday practice—something similar to what we did when we developed a validated risk calculator based on the results of the OHTS study.9
• Do as many tests as you can (according to the patient’s condition). In general, the more tests you do the better, because you get better estimates of how fast patients are changing. Of course, there are limitations on how many tests we can do. We don’t want to burden patients excessively by bringing them to the office all the time, and there are also practical limitations as a result of limited reimbursements.
In my practice, I make sure to get a good set of reliable baseline tests and then I try to obtain these tests about every six months during follow-up, although I tailor the frequency of testing according to the risk. If a patient is at lower risk, I might consider testing him every year instead. If a patient is at high risk, then he will need frequent testing, but that will also depend on other factors, such as life expectancy. For example, a patient who is relatively young and has higher pressures may need to be followed more closely. If you have a 90-year old patient, you probably don’t need to test as often.
• Beware of false positives. One problem with technology like OCT is that it provides a huge amount of information. If you’re going to look at every single parameter or piece of information it produces, that’s going to increase your chances of getting a false positive and drawing a wrong conclusion. Because there are so many measurements, one of them will eventually be abnormal or show a change just by chance. This is what we sometimes call “red disease,” where printouts show abnormalities but the patient is fine. That’s another advantage of having a combined index like the one we’ve developed. Instead of making clinical decisions based on printouts with dozens of parameters that you may not be sure how to interpret, you’d have a single index that integrates the structural and functional information.
For now, when you’re looking for signs of progression, I’d say it’s very important to pay attention to parameters such as the global average thickness of the retinal nerve fiber layer, which has been shown to have very high reproducibility and accuracy for detecting progression.10 Of course, it does have some limitations; the most obvious one is that because it’s a global parameter, you may end up missing some small, localized changes. But it’s a trade-off; if you start off looking at very small areas to try to detect these localized changes, there’s a good chance you will end up making mistakes in terms of false positives. So it makes sense to pay attention to changes in global parameters like average thickness over time. You will end up catching most patients who are in trouble, with a relatively high specificity. For spectral-domain OCT, a change in average thickness of more than 5 µm between tests should be considered very suspicious for indicating true glaucomatous change. However, it is very important to emphasize that any suspicious change should be always confirmed by subsequent testing. REVIEW
Dr. Medeiros is a professor of clinical ophthalmology at the University of California, San Diego and the Ben and Wanda Hildyard Chair for Diseases of the Eye. He is also director of the Visual Performance Laboratory at the Shiley Eye Institute and medical director of the Hamilton Glaucoma Center at UCSD.
1. Medeiros FA, Zangwill LM, Bowd C, Mansouri K, Weinreb RN. The structure and function relationship in glaucoma: implications for detection of progression and measurement of rates of change. Invest Ophthalmol Vis Sci 2012;53:11:6939-46. doi: 10.1167/iovs.12-10345.
2. Medeiros FA, Lisboa R, Zangwill LM, Liebmann JM, Girkin CA, Bowd C, Weinreb RN. Evaluation of progressive neuroretinal rim loss as a surrogate end point for development of visual field loss in glaucoma. Ophthalmology 2014;121:1:100-9. doi: 10.1016/j.ophtha.2013.06.026. Epub 2013 Aug 12.
3. Meira-Freitas D, Lisboa R, Tatham A, Zangwill LM, Weinreb RN, Girkin CA, Liebmann JM, Medeiros FA. Predicting progression in glaucoma suspects with longitudinal estimates of retinal ganglion cell counts. Invest Ophthalmol Vis Sci 2013;54:6:4174-83. doi: 10.1167/iovs.12-11301.
4. Miki A, Medeiros FA, Weinreb RN, Jain S, He F, Sharpsten L, Khachatryan N, Hammel N, Liebmann JM, Girkin CA, Sample PA, Zangwill LM. Rates of retinal nerve fiber layer thinning in glaucoma suspect eyes. Ophthalmology 2014;121:7:1350-8. doi: 10.1016/j.ophtha.2014.01.017. Epub 2014 Mar 13.
5. Gracitelli CP, Abe RY, Tatham AJ, Rosen PN, Zangwill LM, Boer ER, Weinreb RN, Medeiros FA. Association between progressive retinal nerve fiber layer loss and longitudinal change in quality of life in glaucoma. JAMA Ophthalmol 2015;133:4:384-90. doi: 10.1001/jamaophthalmol.2014.5319.
6. Medeiros FA, Lisboa R, Weinreb RN, Girkin CA, Liebmann JM, Zangwill LM. A combined index of structure and function for staging glaucomatous damage. Arch Ophthalmol 2012;130:9:1107-16.
7. Medeiros FA, Zangwill LM, Anderson DR, Liebmann JM, Girkin CA, Harwerth RS, Fredette MJ, Weinreb RN. Estimating the rate of retinal ganglion cell loss in glaucoma. Am J Ophthalmol 2012;154:5:814-824.e1. doi: 10.1016/j.ajo.2012.04.022. Epub 2012 Jul 27.
8. Medeiros FA, Zangwill LM, Mansouri K, Lisboa R, Tafreshi A, Weinreb RN. Incorporating risk factors to improve the assessment of rates of glaucomatous progression. Invest Ophthalmol Vis Sci 2012;53:4:2199-207. doi: 10.1167/iovs.11-8639.
9. Medeiros FA, Weinreb RN, Sample PA, Gomi CF, Bowd C, Crowston JG, Zangwill LM. Validation of a predictive model to estimate the risk of conversion from ocular hypertension to glaucoma. Arch Ophthalmol 2005;123:10:1351-60.
10. Leung CK, Chiu V, Weinreb RN, Liu S, Ye C, Yu M, Cheung CY, Lai G, Lam DS. Evaluation of retinal nerve fiber layer progression in glaucoma: a comparison between spectral-domain and time-domain optical coherence tomography. Ophthalmology 2011;118:8:1558-62. doi: 10.1016/j.ophtha.2011.01.026. Epub 2011 Apr 29.