Technology is changing rapidly, and one of the benefits of that change has been a steady improvement in surgeons’ ability to image and analyze structural change in the eye.1 This is significant, because imaging technology can detect and quantify structural information that would otherwise require very specific training and experience for a surgeon to uncover—if the information could be detected at all. Comparing serial simultaneous stereoscopic optic disc photographs remains the gold standard for detecting glaucoma progression via structural change. However, this isn’t widely done in clinical practice. It’s time-consuming, and the stereoscopic cameras needed to obtain this type of photograph are not widely available. Furthermore, not many of today’s surgeons have the training to expertly examine the photographs.
Fortunately, computer-guided digital technologies such as optical coherence tomography and confocal scanning laser ophthalmoscopy have steadily become more sophisticated, making it possible to monitor, quantify and analyze the eye in ways that would have been impossible a few years ago.
Evolving Clinical Analysis
Robert N. Weinreb, MD, distinguished professor and chair of ophthalmology at the University of California San Diego and director of both the Shiley Eye Center and the Hamilton Glaucoma Center at UCSD, believes that imaging technology has reached the point at which it deserves to be an integral part of glaucoma management.
“Traditionally, the clinical approach to managing glaucoma has been to examine for progression or to stage the disease, and then base our treatment on a prediction of the patient’s probable loss of function,” he says. “Until recently, we’ve detected progression largely using event-based analysis. Such an approach looks for a progression milestone—i.e., the event. For example, we might use the technology to determine whether an observed loss of neuroretinal rim is outside of two standard deviations found in a normative database. Or, we might seek to ascertain whether the mean deviation in a visual field has worsened by a certain amount.
| ||||
Dr. Weinreb cites a recent study that used OCT to evaluate retinal nerve fiber layer thickness in 116 eyes over a period of five years, using Zeiss’s guided progression analysis system.2 “The data showed that this was an effective way to identify individuals exhibiting progressive loss, as well as to determine their rate of loss,” he says. “Notably, the group of subjects identified by this method only slightly overlapped those showing progression by visual field analysis.”
Benefits of Imaging
Dr. Weinreb notes that imaging technology offers a number of significant advantages as a tool for managing glaucoma:
• Today’s imaging technology allows expert examination by non-experts. “For example, several studies have demonstrated that digital analysis of serial confocal scanning laser ophthalmoscopy images compares favorably with expert comparison of serial optic disc stereophotographs,” he says. “In one study this technology performed at least as well for detecting optic nerve changes caused by experimentally induced IOP increases in monkey eyes as glaucoma specialists evaluating photographs.3 Two other studies also found reasonable agreement between CSLO images analyzed with proprietary software and analysis of optic disc photographs.”4,5
• Image acquisition is relatively easy. “Ease of image acquisition is valuable because ease of use allows more frequent scanning, which is important for determining the rate at which the disease is progressing,” he points out. “The more frequently you conduct exams, the better your estimates of the rate of change.”
• Digital data is more easily analyzed. “The quantified nature of digital data is ideal for statistical analysis and comparison,” notes Dr. Weinreb. “This is a key factor in our developing ability to calculate the rate of glaucoma progression, making it possible to predict which individuals are at the greatest risk of functional impairment and/or blindness.”2,6
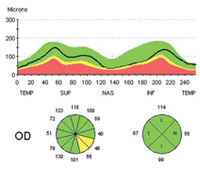
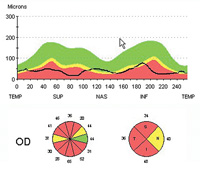
• Imaging provides an objective measure of progression. “When we examine a patient clinically, we may think the eye looks worse,” he says. “Perhaps the rim is narrower, or the RNFL appears to be thinner. But with today’s imaging technology we have objective, quantitative measures that studies are showing correlate well to disease progression.”
Dr. Weinreb cites one recently published study that used Zeiss’s Stratus OCT to obtain RNFL measurements in 253 eyes of 253 patients annually, while also obtaining visual fields and optic disc stereophotographs. Progression was detected with the visual fields using Zeiss’s GPA soft-ware and by masked assessment of the stereophotographs by expert graders. The data showed that mean rates of change in average RNFL thickness were significantly higher in eyes that progressed, with a sensitivity of 77 percent and specificity of 80 percent.7 “Notably, RNFL parameters were significantly better at discriminating progressed eyes than measurements of the optic nerve head or macular thickness,” he adds.
• Reproducibility is better than that obtained with clinical assessment of photographs, and better than the test-retest variability of most clinicians. Dr. Weinreb notes that this is true at least in part because digital data capture and analysis is non-subjective.
• Digital data is easily exported into electronic medical records. “This advantage is likely to become even more significant as medicine continues to move toward the paperless office,” he points out.
• Imaging allows measurement of anatomical features that can’t otherwise be measured. These include the lamina cribrosa and choroidal thickness, as shown in a recent study.8 “Some of these regions are showing promise as bellwethers that may reveal glaucomatous damage early in the disease,” he notes.
“For example, measuring the ganglion cell complex in the macula has turned out to be a very sensitive and specific test for glaucomatous damage,” he says. (Retinal ganglion cells extend through three layers: the retinal nerve fiber layer; the ganglion cell layer; and the inner plexiform layer, which consists of the retinal ganglion cell dendrites.) “The reason for measuring the ganglion cell complex at the macula is that the retinal ganglion cells have the greatest density in this area, where they can be six cells deep. In fact, 50 percent of retinal ganglion cells are located in the central 4.5 mm around the macula. So even though the macula is a very small part of the retina, you can detect signs of change there with high sensitivity.”
• Imaging allows earlier and more informed clinical decisions than simple clinical examination. “Thanks to steady improvements in instruments’ speed of image capture and resolution, as well as improved software for data analysis, our ability to detect a problem early in the disease continues to improve, surpassing what we can discover with a traditional examination,” says Dr. Weinreb. “In some situations, detection of disease and/or progression via imaging may also be possible earlier than would be possible using visual fields.”
Combining Data
|
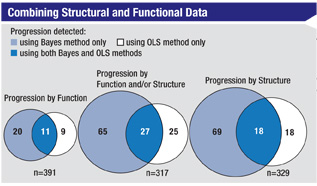
Taking this evolution even further, Dr. Weinreb notes that a recent paper by Felipe Medeiros, MD, PhD, at the UCSD, reported his use of a Bayesian hierarchical model to integrate rates of change from the visual field index (SAP) with average retinal nerve fiber layer thickness measurements made using scanning laser polarimetry with enhanced corneal compensation.9 “The study included data from annual exams of 434 eyes included in the Diagnostic Innovations in Glaucoma Study,” he says. “Dr. Medeiros compared this approach to analysis using the conventional method—ordinary least-squares regression. Although the approaches had equally good specificity when identifying healthy eyes—100 percent—the Bayesian method identified significantly more progressed eyes than the conventional method—22.7 percent vs. 12.8 per-cent (p<0.001). Furthermore, the Bayesian method identified a much greater proportion of the eyes that were categorized as progressing by expert analysis of optic disc stereophotographs than the OLS regression method did: 74 percent vs. 37 percent (p=0.001).”
Clearly, says Dr. Weinreb, combining structural and functional data holds promise as a resource for monitoring glaucoma progression.
|
.jpg)
Imaging Caveats
Of course, today’s imaging technology is still far from perfect, and human error is still a factor during clinical use, so when using this technology it’s important to be conscious of its limitations and the ways in which it can produce misleading data. Dr. Weinreb notes several important considerations:
• Imaging isn’t 100-percent accurate. “For that reason, clinicians must take all available information into consideration, including functional measurements, and use their best clinical judgment to evaluate the information as a whole,” he says.
• Assessment of scan quality is important. Dr. Weinreb notes that the best technology can still be undercut by artifacts, eye movement, corneal conditions and the like.
• Atypical patients may produce misleading data. “There are many atypical patients—particularly high myopes or patients with tilted discs—for whom you can’t readily interpret the information these technologies are able to produce,” he observes.
• Normative databases may not be representative of all patient populations. “A normative database from a European ancestry population is not necessarily relevant to a Japanese population,” he points out. “Furthermore, normative databases are statistical in nature. That means there’s always a low probability that a patient who is outside normal parameters according to the database really is normal, but happens to fall at the low end of the statistical distribution.”
It’s a Good Time to Start
Despite these limitations, Dr. Weinreb believes that the evidence has demonstrated that imaging technologies are ready for use in glaucoma clinical practice. “With all the new software that’s available, including the ganglion cell complex analyses for diagnosis, trend analysis for progression and the ability to combine structural and functional testing, there’s an opportunity to use imaging much more effectively in clinical practice than has been possible previously,” he says. “That belief is also shared by the World Glaucoma Association, and the Preferred Practice Patterns of the American Academy of Ophthalmology, both of which recommend imaging as part of routine clinical care.”
Dr. Weinreb notes that in the glaucoma community, the evolution of imaging technology has added fuel to the ongoing debate regarding whether structural or functional testing is more important for diagnosis and/or monitoring the progression of the disease. “If imaging technology is ready for clinical use in glaucoma management—and the clinical evidence suggests that it is—which approach should clinicians rely upon?” he asks. “My answer is that we need to take advantage of both structural and functional testing, rather than relying primarily on one or the other. The data they provide are complementary.
“Of course, because they monitor different aspects of the disease, one approach or the other may be more efficacious in a given situation, depending on factors such as how many tests you’re doing and the stage of the patient’s disease,” he continues. “For example, structural testing is probably more sensitive early in the disease process; in late-stage disease, visual fields are probably better. The structure is so damaged at that point that it’s hard to detect any increase in the damage.
“If your practice still relies primarily on basic examination and visual fields, this is a good time to consider investing in some of this technology, given all the outstanding instruments and software packages that are available,” he concludes. “Just remember not to rely exclusively on imaging for your final decisions about diagnosis or treatment. There’s no substitute for good clinical judgment.”
1. Mansouri K, Leite MT, Medeiros FA, Leung CK, Weinreb RN. Assessment of rates of structural change in glaucoma using imaging technologies. Eye 2011;25:3:269-77.
2. Leung CK, Cheung CY, Weinreb RN, et al. Evaluation of retinal nerve fiber layer progression in glaucoma: A study on optical coherence tomography guided progression analysis. Invest Ophthalmol Vis Sci 2010;51:1:217-22.
3. Burgoyne CF, Mercante DE, Thompson HW. Change detection in regional and volumetric disc parameters using longitudinal confocal scanning laser tomography. Ophthalmology 2002;109:455-466.
4. Ervin JC, Lemij HG, et al. Clinician change detection viewing longitudinal stereophotographs compared to confocal scanning laser tomography in the LSU Experimental Glaucoma (LEG) Study. Ophthalmology 2002;109:467-481.
5. Chauhan BC, McCormick TA, et al. Optic disc and visual field changes in a prospective longitudinal study of patients with glaucoma: Comparison of scanning laser tomography with conventional perimetry and optic disc photography. Arch Ophthalmol 2001;119:1492-1499.
6. Kourkoutas D, Buys YM, Flanagan JG, Hatch WV, Balian C, Trope GE. Comparison of glaucoma progression evaluated with Heidelberg retina tomograph II versus optic nerve head stereophotographs. Can J Ophthalmol 2007;42:1:82-88.
7. Medeiros FA, Zangwill LM, Alencar LM, Bowd C, Sample PA, Susanna R Jr, Weinreb RN. Detection of glaucoma progression with stratus OCT retinal nerve fiber layer, optic nerve head, and macular thickness measurements. Invest Ophthalmol Vis Sci. 2009;50:12:5741-8.
8. Lee EJ, Kim TW, Weinreb RN, Park KH, Kim SH, Kim DM. Visualization of the lamina cribrosa using enhanced depth imaging spectral-domain optical coherence tomography. Am J Ophthalmol 2011;152:1:87-95.
9. Medeiros FA, Leite MT, Zangwill LM, Weinreb RN. Combining structural and functional measurements to improve detection of glaucoma progression using Bayesian hierarchical models. Invest Ophthalmol Vis Sci 2011;52:8:5794-803.