Eligibility Criteria
Eligibility criteria are an important initial consideration. When evaluating a study, ask: Do baseline demographics, prior treatment and disease severity or duration correlate with current clinical practice?
Inclusion and exclusion criteria determine a study’s relevance to clinical practice, with broad eligibility criteria typically being more generalizable to the overall clinic population. Important criteria to review include mean age, ethnicity, prior ocular therapy and range of eligible baseline best corrected visual acuity. For example, subjects who have undergone prior therapy for AMD or diabetic retinopathy are obviously not comparable to treatment-naïve patients. Subjects who enter trials with relatively good BCVA can’t improve meaningfully due to a ceiling effect, and experience a loss of vision more often than those subjects with worse baseline BCVA, despite treatment with anti-VEGF therapy.1-4
Other important inclusion criteria include features of the disorder under investigation, such as the size and location of the choroidal neovascularization in nAMD studies, or the degree of macular ischemia and the severity of underlying diabetic retinopathy in DME studies, as well as systemic comorbidities such as uncontrolled systemic hypertension or diabetes.
Randomization and Masking
Another important question to ask: Did the study randomize and mask treatment assignments to limit bias?
RCTs of disorders with established therapies are run with concurrent, active standard-of-care control groups. Previously, this meant macular laser photocoagulation for DME (as in the VISTA/VIVID aflibercept trials), and more recently anti-VEGF monotherapy for both DME (as in DRCR Protocol T comparative effectiveness trial) and nAMD (as in the CATT comparative effectiveness and VIEW aflibercept trials).5-8 Randomization limits selection bias, while double masking of treatment assignment, to both the subject and evaluators, limits performance and measurement bias, respectively. Non-randomized studies or those that use only baseline values as controls could suffer from multiple biases, including a placebo effect, while those that use historic controls may not use a comparable subject set.
Endpoints
Key considerations at this phase of the evaluation are: Were endpoints relevant to clinical practice? Were validated endpoints used?
Primary endpoints should provide the most clinically important evidence of the trial’s primary objective. Historically, primary endpoints have been validated functional endpoints that involve vision, although more recently the FDA has accepted “surrogate endpoints” which can be biomarkers predictive of, and correlated to, visual function, such as change in area of geographic atrophy in dry AMD treatment trials (as in the MAHALO and CHROMA/SPECTRI lampalizumab trials). However, endpoints involving central visual function may be more clinically meaningful to patients in clinical practice, than surrogate or anatomic endpoints, such as the proportion of patients with a two-step progression in diabetic retinopathy severity scale. Secondary and supportive endpoints should provide additional contextual, supportive and clinical meaningfulness to the primary
 |
When evaluating a trial’s endpoints, also ask: Were endpoints categorical or numeric? Were relevant responder analyses assessed?
Endpoints can be categorical (nonmetric) or numeric (metric) variables. The mean change in early treatment of diabetic retinopathy (ETDRS) BCVA (a numeric endpoint) involves protocol refraction by masked certified VA examiners, and is a reliable and well-established functional assessment. (Unless otherwise noted, this article will use “BCVA” to denote ETDRS best corrected visual acuity.) As a validated and continuous metric (i.e., with intermediary values between whole numbers), BCVA captures macular function better than most other endpoints, as even small changes in its magnitude can reflect marked benefit or harm for subjects.
“Responder analyses” involve categorical endpoints, such as the proportion of subjects achieving the level of vision correlating to driving legally, reading without difficulty or avoiding legal blindness. Although categorical endpoints are associated with loss of information (i.e., a dichotomous outcome at the subject level, either achieving a visual milestone or not), responder analyses aren’t affected by outliers and provide context, translating a BCVA endpoint to clinically relevant functional outcomes at the subject level.9 A seemingly small change in mean BCVA for an entire clinical trial cohort often translates into a large clinically meaningful change in a responder analysis at the subject level. A meta-analysis of clinical trials in nAMD published in 2007 noted that a change in mean BCVA of five letters or less can yield significant subject benefit. The meta-analysis found that a mean change in BCVA of five letters for a cohort resulted in twice as many eyes (32 vs. 16 percent) with a ≥15-letter improvement and 28 percent fewer eyes (13 percent vs. 18 percent) with a ≥15-letter worsening.10 Other large clinical trials have demonstrated that even smaller numbers of letters gained can provide notable benefit for subjects. For example, in the MEAD trial, the 0.7-mg dexamethasone implant arm showed a 1.5-letter benefit compared to sham at three years (3.5- vs. 2-letter gain, p=0.023), which respectively translated to 22 percent vs. 12 percent gaining at least three lines (p<0.001), and therefore meeting its primary endpoint.11
Historically, the proportion of subjects losing less than 15 letters (three lines) of BCVA has been used as a primary endpoint in Phase III registration trials of anti-VEGF agents for nAMD (as in the MARINA and ANCHOR ranibizumab trials, as well as VIEW aflibercept trials).7,12,13 The MARINA trial ushered in the age of vision-improving therapy, with 95 percent of nAMD subjects losing less than three lines, compared to 62 percent in the untreated control group.12 However, in current nAMD treatment trials involving actively treated control groups (receiving standard anti-VEGF agents), a vast majority of subjects treated with anti-VEGF monotherapy would be “responders” (~95 percent losing less than 15 letters of BCVA).7,12,13 Consequently, this endpoint would be very susceptible to ceiling effects. For example, in the VIEW aflibercept trials, which also used this primary endpoint, ≥94 percent of all subjects across treatment groups lost less than 15 ETDRS letters.7
Analysis and Study Design
Important considerations when evaluating a study’s analysis and design include:
• Pre-specified analysis. A central pillar of RCT design is that endpoints and analysis be pre-specified, typically in a statistical analysis plan. Post hoc analysis, which involves the assessment of endpoints selected after unmasking of data is acceptable for hypothesis generation and planning for additional RCTs, but generally not acceptable for an efficacy claim.
• Descriptive analysis, confidence intervals and inferential analysis. Descriptive analysis summarizes and organizes data and includes familiar terms such as mean, median and range, as well as histograms displaying the distribution of values. Exploratory analyses employing descriptive statistics are useful for hypothesis generation and may facilitate planning of additional RCTs.
Confidence intervals reflect the certainty that a result from a study sample represents a true measure of an entire population. CIs are based on the Central Limit Theorem. For sample sizes greater than 30, CI = sample mean +/- standard error of the mean, and SEM = (Standard Deviation of the sample)/(square root of the number in sample). Thus, large samples with little variation yield narrow CIs. Very large samples approaching the population size would appropriately yield a CI approaching zero, indicating that the sample mean is approaching the population mean.
For example, a mean BCVA of seven letters, derived from a sample of study subjects, with a 95% CI of four to 10 letters, indicates that there is 95-percent certainty that the true mean BCVA for the entire population under the same conditions would be four to 10 letters.
Inferential analysis involves hypothesis testing, to assess the likelihood that a difference between treatment and control groups isn’t due to chance (“the null hypothesis”), but a true difference (“rejecting the null hypothesis”). The conventional threshold for statistical significance (“alpha”) of p<0.05 indicates that there is less than a 5-percent likelihood that a difference between the treatment and control groups is due to a play of chance (a false positive or a type 1 error—a trade-off with a false negative or type 2 error, correlating to “beta”). Regulatory bodies usually require two RCTs with statistically significant results (p<0.05), to decrease type 1 errors (because the likelihood that the outcome is due to a play of chance in both RCTs is less than 0.05 x 0.05, or less than 0.25 percent).
The power of a study reflects the chance of obtaining a true negative result (i.e., not committing a type 2 error, which equals 1 – beta, conventionally adequate at 0.8). Increasing sample size increases power, while decreasing both alpha and beta and simultaneously addressing trade-offs among these parameters.
The t-test is a familiar test for continuous variables, used to compare means between two samples, such as mean change in BCVA in the treatment group versus the control group. Similarly, analysis of variance (ANOVA) testing is a test for continuous variables, but used to compare means of three or more groups. Chi-square tests are for categorical variables, such as the proportion of subjects losing less than 15 letters. Fisher’s Exact Tests are similar to Chi-Square Tests, but used with small sample sizes.
• Controlling for multiplicity. When RCTs perform inferential analysis on multiple endpoints, multiple doses or multiple time points (i.e., an interim analysis), type 1 error increases because, with each analysis, achieving a falsely positive significant difference between treatment and control due to a play of chance becomes increasingly likely. Consequently, analyses must control for multiplicity. Perhaps the simplest and best-known correction for multiplicity is the Bonferroni Method, which is a conservative method (used in CATT8). For example, in a study with a predefined statistical significance of p<0.05, the Bonferroni method controls type 1 error by simply redefining statistical significance as p<0.05/n for each analysis, where n represents the number of analyses.14
Another method, which doesn’t redefine statistical significance based on the number of inferential tests, involves prespecification of the hierarchical order in which endpoints are inferentially assessed, and discontinuing this sequence of testing at the point at which statistical significance is not achieved (used in the VIEW7 and VISTA/VIVID5 trials).
• Does the primary analysis involve superiority or non-inferiority? RCTs can be designed as superiority or non-inferiority studies, as well as equivalence studies. In nAMD and DME clinical trials, superiority study design has been used to compare first-in-class therapies to sham control (when approved therapies didn’t exist), or to previous therapies. For example, in both MARINA and RISE/RIDE, the primary endpoint analysis was superiority of ranibizumab to sham control, with respect to the proportion of nAMD subjects losing less than 15 ETDRS letters of BCVA at 12 months for MARINA, or the proportion of DME subjects gaining at least 15 ETDRS letters of BCVA at 24 months for RISE/RIDE.12,15
In ANCHOR, the primary endpoint analysis was superiority of ranibizumab vs. control verteporfin photodynamic therapy (already approved for the classic choroidal neovascular lesions enrolled in this trial), with respect to the proportion of nAMD subjects losing less than 15 ETDRS letters of BCVA at 12 months.13 In VISTA/VIVID, the primary endpoint analysis was superiority of aflbercept to macular laser photocoagulation for DME, with respect to the mean change of BCVA at 12 months.5
A non-inferiority design is often used to compare a second-in-class or generic therapy to an approved therapy. Product differentiation can be achieved by less-frequent dosing, improved safety or tolerability, and/or lower cost, particularly for a generic or off-label agent such as bevacizumab. An acceptable level of difference between the two therapies is predefined as non-inferiority; typically, the 95% confidence interval of the observed difference must be less than this predefined level. For example, in CATT, which used the Bonferroni method for multiple comparisons (alpha of 5 percent divided by six pairwise comparisons), the primary endpoint analysis was noninferiority of bevacizumab to ranibizumab regimens for nAMD, with respect to the mean change of BCVA at month 12, with the 99.2% confidence interval of the difference to fall within a prespecified five letters.8 In contrast, in the VIEW trials, which used hierarchical analysis, the primary endpoint analysis was noninferiority of aflibercept regimens to ranibizumab, with respect to the proportion of subjects losing less than 15 ETDRS letters at month 12, with the 95% confidence interval of the difference to fall within a prespecified 10-percent margin for noninferiority.7 Incidentally, although
 |
While non-inferiority would appear on its face to represent a lower hurdle than superiority, demonstrating non-inferiority within the typically tight predefined band often requires more patients to achieve the same power.
• Was an intent-to-treat analysis performed? Is missing data described and addressed? In retina treatment trials, subject dropout is often related to poor response to treatment, transportation issues, cost, older age, treatment fatigue, illness and/or death.1,16-19 Moreover, it’s been observed that nAMD subjects ultimately lost to follow-up have worse evolving visual outcomes compared to other subjects.1,3,18 Consequently, missing data from subject dropout in RCTs may overestimate visual outcomes. Therefore, three analysis populations are typically predefined:
— The intent-to-treat population (ITT) consists of all randomized subjects who received at least one dose of the study drug and underwent at least one follow-up visit, regardless of the dose actually received or the visits completed.
— The per-protocol (PP) population consists of all ITT subjects without any significant violation of the protocol, such as missing a critical number of planned treatments.
— The safety population includes all subjects who received at least one injection of the study drug.
The main analysis for the primary efficacy endpoint should consist of the ITT population. Analysis of a per-protocol population, in which subjects lost to follow-up are excluded from analysis, can yield an overestimation of visual outcomes. In a well-managed clinical trial without high subject dropout, the ITT and PP populations would ideally be nearly identical. Similarly, analyses of an ITT population that is modified after unmasking the data (a “modified ITT population,” or mITT) may allow selection bias to creep into the analysis, and should be subjected to careful scrutiny.
In the past, addressing missing data through analysis of an ITT population, with last observation carried forward (LOCF), was commonly performed (as in MARINA,12 ANCHOR,13 VIEW,7 RISE/RIDE15 and VISTA/VIVID5). However, the LOCF imputation approach relies on the erroneous assumption that vision remains constant after loss to follow-up, and consequently can inflate study results.20-23 In contrast, nonresponder imputation rigorously considers any subject with missing data to have missed the endpoint, deflating study results. Additional methods such as multiple imputation (used in CATT8) make use of other data within the study to estimate the missing data.20,24
• Were sensitivity analyses conducted and, if so, were they appropriate? Sensitivity analyses are employed to confirm the robustness of data (i.e., that the observed outcomes remain true across a variety of missing data scenarios and assumptions). Historically, for the analysis of the primary endpoint, analysis using a LOCF imputation approach, or analysis of only subjects completing the particular time point of interest, or a worst observation carried forward imputation approach (WOCF) has been used.
• Were any confounding imbalances in baseline demographics between treatment and control groups addressed? When interpreting study results, it’s important to assess if the treatment groups are balanced in demographic and clinical characteristics, especially those confounding factors known to influence the outcome measures, because even randomization can sometimes lead to imbalances, especially when evaluating subgroups (although this tends to diminish with increasing study sample size). In general, stratification at enrollment can control for two to three confounding imbalances in baseline features known to affect study outcomes,25 such as age, baseline BCVA or CNV size and type in nAMD RCTs.
In addition, analysis of covariance (ANCOVA, not to be confused with ANOVA) is a familiar test of significance that can simultaneously control for covariates. Clinicians should carefully scrutinize RCTs involving important baseline demographic imbalances that haven’t been addressed.
Totality of the Data
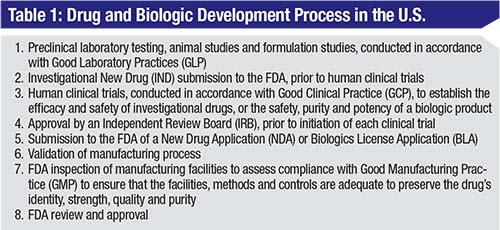
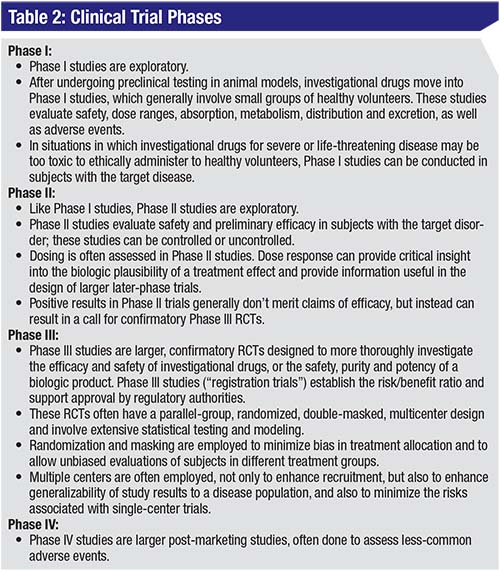
Since they’re exploratory and designed for preliminary assessment, Phase I and IIa clinical trials don’t address many of the issues noted above, as they may lack controls, randomization, masking or power for inferential analysis. In addition, regardless of phase, clinical trials often don’t meet all endpoints. Consequently, assessing the totality of the data can provide insight into the utility of a potential therapy. Here are some key questions and considerations:
• Are endpoint results internally consistent? Are the secondary endpoints supportive of, and consistent with, the primary visual endpoints? If the primary endpoint isn’t met, then secondary and supportive endpoints are generally less meaningful, although they can be important for hypothesis generation and for planning of future trials. Secondary and supportive visual function endpoints, such as responder analyses, should be internally consistent. Secondary and supportive anatomic endpoints are most commonly used to contextually support the functional benefit of an intervention, by supporting a mechanism of action and biologic plausibility. These anatomic endpoint outcomes should be consistent with the observed visual benefit of an intervention.
• Is there a dose-response effect? A dose-response effect is an intuitive check on the results of a RCT. Dose response suggests biologic plausibility, and typically plateaus at higher levels, resulting in dose-response curve. In addition to supporting biologic plausibility, dose response can help inform the design of larger, later-phase trials.
• What is the actual p-value of the study? How large is the treatment effect? Regardless of p-values, is the effect clinically meaningful? Statistical significance increases with larger effect size and lower variation. Since larger studies generally reduce variation surrounding mean values, a large study demonstrating a small treatment effect can achieve statistical significance, while a small study suggesting greater treatment effect may fail to achieve statistical significance (a type 2 error, equal to the value of beta). In these small trials, a near-significant result may assist with hypothesis generation and inform future trial design.
For example, in the Phase II MAHALO study of lampalizumab in geographic atrophy due to AMD, which included a surrogate primary endpoint of mean change in GA lesion area at month 18, there was 20-percent reduction associated with monthly dosing compared to sham control, with a p-value of 0.117, in a mITT analysis with LOCF.26 Due to the small size of this proof-of-concept study (129 subjects randomized to two dose groups or sham), which isn’t uncommon for Phase II studies, there was no multiplicity adjustment and a liberal prespecified level of significance of p<0.2 to minimize type 2 error (trading off against increased type 1 error). Given the effect size (and even greater 44-percent treatment effect in a subgroup analysis) for a blinding disorder with no approved treatment, lampalizumab advanced into Phase III trials.
The treatment effect size can be assessed further with several parameters. Absolute risk reduction (ARR) is the absolute difference in outcomes between the treatment and control groups. For example, in the MARINA trial, with 95 percent of treated subjects losing less than three lines compared to 62 percent in the sham group, the absolute risk reduction of losing at least three lines compared to sham at 12 months was 38% - 5% or 33%. The relative risk reduction (RRR) was 33%/38% or 87%. The effect size can be better understood by considering the number needed to treat (NNT), which is the reciprocal of absolute risk reduction. In MARINA, this results in an NNT of 1/0.33 or 3, indicating that a physician would need to treat three nAMD patients with monthly ranibizumab to prevent a ≥3-line loss in one patient at 12 months. In comparison, an article in the January 17, 2008 issue of Business Week magazine found that the NNT to prevent myocardial infarction via a daily statin for 3.5 years approaches 100 (in those with risk factors but without prior heart disease).27 One very interesting website (http://www.thennt.com/) uses the NNT from evidence-based studies (mostly Cochrane Reviews) to evaluate a broad range of therapies and lists an NNT of 7 to resolve bacterial conjunctivitis at two to five days via topical antibiotics.
In summary, proper interpretation of RCT results is vital in order to appropriately apply the findings to clinical practice and to guide therapy. This would include consideration of the RCT phase, design, subject selection criteria, choice of control, dose selection, masking and selection of the endpoints. Review of statistical methodology can be intimidating, but clinicians can check for vital statistical items such as predefined levels of significance, analysis populations and multiplicity, as well as any methods used to handle missing data, which is a common problem in RCTs involving elderly or ill subjects. Finally, remember that it’s important to assess all the data for internal consistency, dose response, and size of treatment effect. REVIEW
Dr. Ciulla is a volunteer clinical professor of ophthalmology at the Indiana University School of Medicine, and serves on the Retina Service at Midwest Eye Institute. He can be reached at thomasciulla@gmail.com, or at 317-817-1822 (phone) and 317-817-1898 (fax). He has an employment relationship with Ophthotech Corporation.
1. Rasmussen A, Bloch SB, Fuchs J, et al., A 4-year longitudinal study of 555 patients treated with ranibizumab for neovascular age-related macular degeneration. Ophthalmology 2013;120:12:2630.
2. Ross AH, Donachie PH, Sallam A, et al. Which visual acuity measurements define high-quality care for patients with neovascular age-related macular degeneration treated with ranibizumab? Eye (Lond) 2013;27:1:56-64.
3. Talks JS, Lotery AJ, Ghanchi F, et al. First-year visual acuity outcomes in the united kingdom of providing aflibercept according to the VIEW study protocol for age-related macular degeneration. Ophthalmology 2015;123:2:337-43.
4. Writing Committee for the U. K. Age-Related Macular Degeneration EMR Users Group. The neovascular age-related macular degeneration database: Multicenter study of 92,976 ranibizumab injections: Report 1: Visual acuity. Ophthalmology 2014;121:5:1092-101.
5. Korobelnik JF, Do DV, Schmidt-Erfurth U, et al. Intravitreal aflibercept for diabetic macular edema. Ophthalmology 2014;121:11:2247-54.
6. Diabetic Retinopathy Clinical Research N, Wells JA, Glassman AR, et al. Aflibercept, bevacizumab, or ranibizumab for diabetic macular edema. N Engl J Med 2015;372:13:1193-203.
7. Heier JS, Brown DM, Chong V, et al. Intravitreal aflibercept (VEGF trap-eye) in wet age-related macular degeneration. Ophthalmology 2012;119:12:2537-48.
8. CATT Research Group, Martin DF, Maguire MG, et al. Ranibizumab and bevacizumab for neovascular age-related macular degeneration. N Engl J Med 2011;364:20:1897-908.
9. Tal J. Strategy and statistics in clinical trials: A non-statistician’s guide to thinking, designing, and executing. Vol IX. Amsterdam, Boston: Academic Press, 2011:267.
10. Beck RW, Maguire MG, Bressler NM, et al. Visual acuity as an outcome measure in clinical trials of retinal diseases. Ophthalmology 2007;114:10:1804-9.
11. Boyer DS, Yoon YH, Belfort R Jr, et al. Three-year, randomized, sham-controlled trial of dexamethasone intravitreal implant in patients with diabetic macular edema. Ophthalmology 2014;121:10:1904-14.
12. Rosenfeld PJ, Brown DM, Heier JS, et al. Ranibizumab for neovascular age-related macular degeneration. N Engl J Med 2006;355:14:1419.
13. Brown DM, Kaiser PK, Michels M, et al. Ranibizumab versus verteporfin for neovascular age-related macular degeneration. N Engl J Med 2006;355:14:1432-44.
14. Wang D, Li Y, Wang X, et al., Overview of multiple testing methodology and recent development in clinical trials. Contemp Clin Trials 2015;45:Pt A:13-20.
15. Nguyen QD, Brown DM, Marcus DM, et al. Ranibizumab for diabetic macular edema: Results from two phase III randomized trials: RISE and RIDE. Ophthalmology 2012;119:4:789-801.
16. Singer MA, Awh CC, Sadda S, et al. HORIZON: An open-label extension trial of ranibizumab for choroidal neovascularization secondary to age-related macular degeneration. Ophthalmology 2012;119:6:1175-83.
17. van Asten F, Evers-Birkenkamp KU, van Lith-Verhoeven JJ, et al. A prospective, observational, open-label, multicentre study to investigate the daily treatment practice of ranibizumab in patients with neovascular age-related macular degeneration. Acta Ophthalmol 2015;93:2:126.
18. Kruger Falk M, Kemp H, and Sorensen TL. Four-year treatment results of neovascular age-related macular degeneration with ranibizumab and causes for discontinuation of treatment. Am J Ophthalmol 2013;155:1:89-95 e3.
19. Holz FG, Tadayoni R, Beatty S, et al. Multi-country real-life experience of anti-vascular endothelial growth factor therapy for wet age-related macular degeneration. Br J Ophthalmol 2015;99:2:220-6.
20. Olsen MK, Stechuchak KM, Edinger JD, et al. Move over LOCF: Principled methods for handling missing data in sleep disorder trials. Sleep Med 2012;13:2:123-32.
21. Wong WK, Boscardin WJ, Postlethwaite AE, et al. Handling missing data issues in clinical trials for rheumatic diseases. Contemp Clin Trials 2011;32:1:1-9.
22. Hedden SL, Woolson RF, Carter RE, et al. The impact of loss to follow-up on hypothesis tests of the treatment effect for several statistical methods in substance abuse clinical trials. J Subst Abuse Treat 2009;37:1:54-63.
23. Mallinckrodt CH, Sanger TM, Dube S, et al. Assessing and interpreting treatment effects in longitudinal clinical trials with missing data. Biol Psychiatry 2003;53:8:754-60.
24. O’Neill RT, Temple R. The prevention and treatment of missing data in clinical trials: An FDA perspective on the importance of dealing with it. Clin Pharmacol Ther 2012;91:3:550-4.
25. Cunningham ET Jr, Acharya N, Kempen JH, et al. Design and interpretation of clinic-based studies in uveitis. Ocular Immunology and Inflammation 2015;23:4:267-270.
26. Yaspan BL, Williams DF, Holz FG, et al. Targeting factor D of the alternative complement pathway reduces geographic atrophy progression secondary to age-related macular degeneration. Sci Transl Med 2017;9:395.