Generally, ophthalmologists treating glaucoma haven’t paid much attention to the macula because it’s been widely accepted that glaucoma primarily affects an individual’s peripheral vision. That myth was perpetuated in the past because Goldmann perimetry doesn’t allow us to detect small amounts of central vision loss; the six-degree grid spacing of most automated perimetry algorithms doesn’t adequately sample the central 10 degrees of the visual field. In addition, prior to the advent of optical coherence tomography we had no way to analyze the condition of the macular structure. So, ophthalmologists focused on the topography of the optic nerve and the central 30 degrees of the visual field.
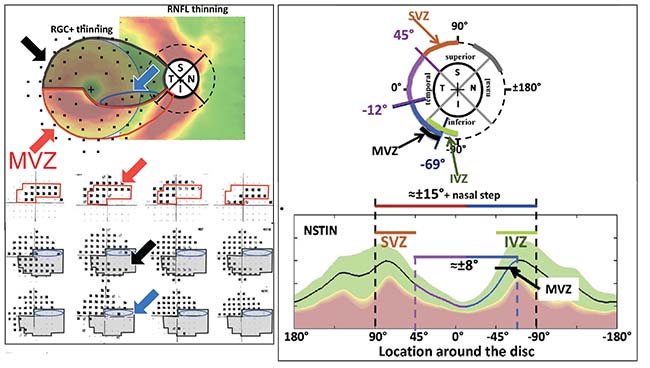 |
| The relationship between the optic nerve and the macula has been well described by Don Hood, PhD. Cells leaving the optic nerve travel to different parts of the retina; damage to those cells that pass through the “macular vulnerability zone”—which includes the segment between 295 degrees and 322 degrees on the inferior optic disc—results in a paracentral visual field defect. (See the red-outlined area in the diagram, above left.) The MVZ is one part of the inferior vulnerability zone, encompassing the inferotemporal section of the optic nerve. (Above, right) This is matched by a superior vulnerability zone that lies above the maculopapular bundle. These nerves are more susceptible to damage than the maculopapular bundle, and they’re responsible for damage seen outside the central 10 degrees at the superior and inferior poles, such as nasal steps, arcuate scotomas and peripheral field loss. (For more information about these correlations, see references 7-9. Diagrams reprinted with permission.) Reprinted from Progress in Retinal and Eye Research, Vol.. 57, Donald C. Hood, Improving our understanding, and detection, of glaucomatous damage: An approach based upon optical coherence tomography, 46-75, 2017, with permission from Elsevier. Reprinted from Progress in Retinal and Eye Research, Vol. 32, Donald C. Hood et al, Glaucomatous damage of the macula, 1-21, 2013, with permission from Elsevier. http://www.sciencedirect.com/science/journal/13509462 |
We now have technologies such as spectral-domain and swept-source OCT that allow us to look at both the circumpapillary region and macular anatomy with ever-increasing resolution. As a result, we can now demonstrate the appearance of structural alterations in regions of the macula in glaucoma patients, localized to retinal ganglion cells and their axons, and the connections to those cells. Problems such as disc hemorrhages have been visible in photographs all along, but our current technology is now revealing the significance of these phenomena and how they correlate to macular damage.
Another side effect of limited technology has been the belief that damage to the central visual field (and the corresponding retinal ganglion cells) only occurs late in the disease. Today’s technology has revealed that some macular defects occur very early in the disease process. Furthermore, they can significantly undercut the patient’s quality of life.
A third widespread idea is that there’s a disconnect between structural damage and functional damage. However, with our increasing ability to image the retina in greater detail, it’s becoming clear that there is a very direct, precise relationship between glaucomatous structural damage and functional impairment throughout the retina, especially in the macula.
A fourth belief that’s been widely accepted is that our imaging devices stop being useful once glaucomatous disease becomes advanced. But as our technology becomes more sensitive, we’re finding out that this may not be the case.
Here, I’d like to share some of what we’ve learned about these issues, to encourage those of us who are treating glaucoma to take full advantage of the technologies now at our disposal and to pay more attention to what’s occurring in the macular region.
The Anatomy of Central Vision
The idea that central loss is occurring in glaucoma isn’t really new; even 50 years ago the literature contained references to central loss.1 It was simply more difficult to measure and evaluate. Ironically, central loss is what’s important to the patient. When patients walk in the door, they don’t say that their nasal step is bothering them. They say they’re having difficulty reading, or they have decreased contrast sensitivity—visual functions that are primarily related to macular function.2,3 They may be having trouble driving, or may be falling because of impaired vision.4-6 In fact, most patients don’t complain about peripheral loss unless it’s se-vere and bilateral. At that point the disease is very advanced.
Because of the prevailing idea that glaucomatous damage is peripheral, we tend to pay minimal attention to the central visual field and central visual function. With our current technology and understanding, that may be a disservice to our patients.
To understand how glaucomatous damage affects vision, it helps to think about macular anatomy. The retinal ganglion cell axons become the retinal nerve fiber layer, which converges on the disk and forms the optic nerve. So when you use OCT to perform a circumpapillary scan, you’re measuring the thickness of the retinal nerve fiber layer. The inner plexiform layer, or IPL, is formed by the connections between the retinal ganglion cells and the inner nuclear layer below it. In the macula, the retinal ganglion cells and the inner plexiform layer are the structural elements that are damaged and thin out; neither the inner nuclear layer itself nor the receptor layer are damaged. So when we measure macular damage in glaucoma, the retinal ganglion cell layer and the inner plexiform layer are typically what we’re measuring.
A note regarding terminology: Although we’re primarily interested in the retinal ganglion cells, it’s very difficult to separate the retinal ganglion cell layer and the inner plexiform layer with our current technology, so we usually treat them as one layer. We refer to this composite layer as the “retinal ganglion cell-plus,” or sometimes simply call it the ganglion cell complex.
The retinal nerve fiber layer tends to be thicker near the disc because all the fibers are converging there. In contrast, when you look at the macula, there’s not much retinal nerve fiber layer. The main focus there is on retinal ganglion cells and the ganglion cell complex. (Note that in the foveal depression, where we have the most photoreceptors and our most sensitive vision, there are no ganglion cells at all. The cell bodies that process the visual information are actually all displaced away from the center a little bit, to allow the light to come through perfectly clearly.)
Vulnerability Zones
The structure-function relationship of glaucomatous damage to the macula has been described in detail by Don Hood, PhD, of Columbia University.7-9 The most susceptible region of the optic disc has been termed the Hood macular vulnerability zone. It’s about 27 degrees wide and lies between 295 degrees and 322 degrees on the inferior optic disc. When damage occurs along the cells’ path through that region, the result is a paracentral visual field deficit. This is well-illustrated in the images.
This macular vulnerability zone corresponds to the inferotemporal location on the nerve and is the part that’s often damaged in glaucoma. This correlation has been confirmed by data from the ADAGES study, which found that an inferotemporal disc hemorrhage is associated with a central visual field deficit. If you see a disc hemorrhage at that location, you need to be concerned about the central field and do a 10-2 visual field test.
Fortunately, not all parts of the macula are equally vulnerable to glaucomatous damage. The retinal ganglion cells and their axons that serve in the superior half of the macula pass through the temporal region of the optic nerve. This region, called themaculopapular bundle, is resistant to damage. (See diagrams) As a result, the part of the macula enervated by those nerves tends to be the last to lose vision. That’s a blessing for those with advanced glaucoma, because they can at least retain central vision until very late in the disease.
It’s worth noting that the macular vulnerability zone is just a part of what’s called the inferior vulnerability zone, encompassing a broader swath of optic nerve rim tissue comprising the inferotemporal section of the optic nerve. This is matched by a superior vulnerability zone that lies above the maculopapular bundle. The superior segment nerves, along with the group of inferior segment nerves that don’t end up in the macula, are more susceptible to damage than the maculopapular bundle; they are responsible for damage seen outside the central 10 degrees at the superior and inferior poles, such as nasal steps, arcuate scotomas and peripheral field loss. Despite the fact that these types of damage are often detected first, central visual loss is probably occurring simultaneously. It may even occur first. It’s simply been more difficult to detect.
Structure and Function
The most important thing to understand is that there really is a direct relationship between structure and function. Once we account for retinal ganglion cell displacement, there’s a high correlation between retinal nerve fiber layer thickness, ganglion cell complex thickness and visual field deficits.10 I’m sure that if our tools were sensitive enough, the loss of a single ganglion cell would be detected as a loss in function. But when we check function with our current technology (the 24-2 strategy with the automated perimeter), that correlation may not be obvious; it might appear that the visual field is still normal, despite the loss of many cells. What we find will depend largely on our technologies and how we use them, but the structure-function relationship has to be intact. Otherwise, everything we know about glaucoma makes no sense.
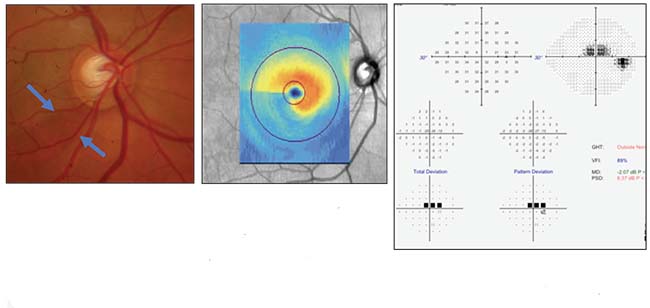 |
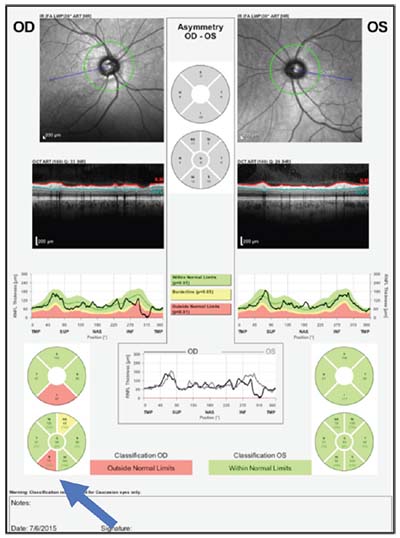
| A case history illustrating the correlation between structure and function. Above and below, left: Disc photo, visual field and OCTs of the optic nerve and macula all confirm inferior macular damage, which correlates with the superior field loss. |
 |
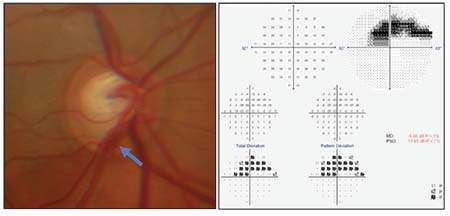 |
| Three months later, the patient has a disc hemorrhage at the same location, indicating ongoing damage. |
The “Floor Effect”
Another way in which the seeming structure-function disconnect has affected our use of technology is via the belief that structural damage always has a “floor effect.” This simply means that at some point, the tissue whose thickness we’re measuring bottoms out; it can’t get any thinner, so measuring it after that won’t tell us anything. For example, once the nerve fiber layer gets to 40 or 50 µm thick, it’s very hard to detect further change.
However, the better our tools, the more we’re finding that this isn’t the case. There’s evidence that this type of structural measurement may still be useful; the key is that while overall thickness may have bottomed out, the thickness in specific key locations may still be changing, even in advanced disease. (Monitoring a specific, small area rather than the entire eye is called the “region of interest” approach.)
For example, the average retinal nerve fiber layer thickness may appear to be normal. If the patient loses a small amount of nerve fiber layer thickness that’s very localized, and you’re just checking the overall thickness, you won’t note much change. The part that’s changing is lost in the averaging process. However, if you look just at the damaged area, you might find very rapid progression.
The same is true for visual fields. If the patient has a normal field but then converts to an abnormal field, only two or three of the points may have changed. The mean deviation doesn’t change that much. But the areas of interest with localized damage (i.e., the few points that are changing) could be changing at -5 or -6 dB per year.
Of course, we’re just figuring out how to use this approach because our technology is advancing so quickly. But the bottom line is that we need to look at regions of interest, not just overall averages of change. The ongoing loss of function is almost certainly accompanied by an ongoing loss of structure; we just haven’t known how to detect it.
Helping Your Patients
Given these insights about how glaucomatous damage may be occurring and may affect the macula, here are a few things you can do to help your patients:
• Ask patients about problems they may be having that relate to loss of central vision. Don’t assume the periphery is the only area needing your attention. Issues associated with central vision deficits may well be associated with the patient’s glaucoma and indicative of damage that needs to be addressed.
• If you see a sign of trouble, test the macular region with the 10-2 test. In order to test the function of central vision, it’s important not to rely on the 24-2 visual field test. In that test, the test points are pretty widely spaced (six-degree separation), resulting in very little information about central vision. In a 10-2 visual field test, the test points are much closer together—spaced about every two degrees. That results in a much more effective test of functional central vision.
• Be alert for signs of trouble in the areas known to be most vulnerable to glaucomatous damage. Now that the structural layout of the ganglion cell complex is better understood, be extra vigilant for signs of damage in the vulnerable zones around the optic nerve.
• If your patient’s glaucoma is progressing, pay close attention to any change in areas already known to be problematic. The evidence suggests that change in areas already subject to trouble is likely to be greater than the overall, average change, making this a more effective warning sign that progression is occurring. This is especially true in advanced glaucoma, where significant damage has already occurred.
• Use all of the technologies available to you. As noted above, our evolving technologies are making it clear that any seeming structure-function disconnect may be an artifact of our technological limitations—limitations that are diminishing every year. So use all the technologies available to you to monitor your patients. REVIEW
Dr. Liebmann is the Shirlee and Bernard Brown Professor of Ophthalmology, vice chair of the Department of Ophthalmology, and director of the Glaucoma Services at Columbia University Medical Center in New York City. He is a consultant to Aerie Pharmaceuticals, Alcon Laboratories, Allergan, Bausch + Lomb, Carl Zeiss Meditec, Diopsys, Inotek, ForSight Vision 5, Quark Pharmaceuticals, SOLX, Sustained Nano Systems and Valeant Pharmaceuticals.
1. Aulhorn E, Harms M. 1967. In: Leydhecker, (Ed.), Glaucoma. Karger, Basel pp. 151-186.
2. Burton R, Crabb DP, et al. Glaucoma and reading: Exploring the effects of contrast lowering of text. Optom Vis Sci 2012;89:9:1282-7.
3. Fujita K, Yasuda N, Oda K, Yuzawa M. [Reading performance in patients with central visual field disturbance due to glaucoma]. Nippon Ganka Gakkai Zasshi 2006;110:11:914-8. [Japanese]
4. Coeckelbergh TR, Brouwer WH, et al. The effect of visual field defects on driving performance: A driving simulator study. Arch Ophthalmol 2002;120:11:1509-16.
5. Bronstad PM, Bowers AR, et al. Driving with central field loss I: Effect of central scotomas on responses to hazards. JAMA Ophthalmol 2013;131:3:303-9.
6. Klein BE, Klein R, et al. Performance-based and self-assessed measures of visual function as related to history of falls, hip fractures, and measured gait time. The Beaver Dam Eye Study. Ophthalmology 1998;105:1:160-4.
7. Hood DC, Raza AS, de Moraes CG, et al. Initial arcuate defects within the central 10 degrees in glaucoma. Invest Ophthalmol Vis Sci 2011;52:2:940-6.
8. Hood DC. Improving our understanding, and detection, of glaucomatous damage: An approach based upon optical coherence tomography. Prog Retin Eye Res 2017;57:46-75.
9. Hood DC, Raza AS, de Moraes CG, et al. Glaucomatous damage of the macula. Prog Retin Eye Res 2013;32:1-21.
10. Le PV, Tan O, et al. Regional correlation among ganglion cell complex, nerve fiber layer, and visual field loss in glaucoma. Invest Ophthalmol Vis Sci 2013;54:6:4287-95.


